


问题描述
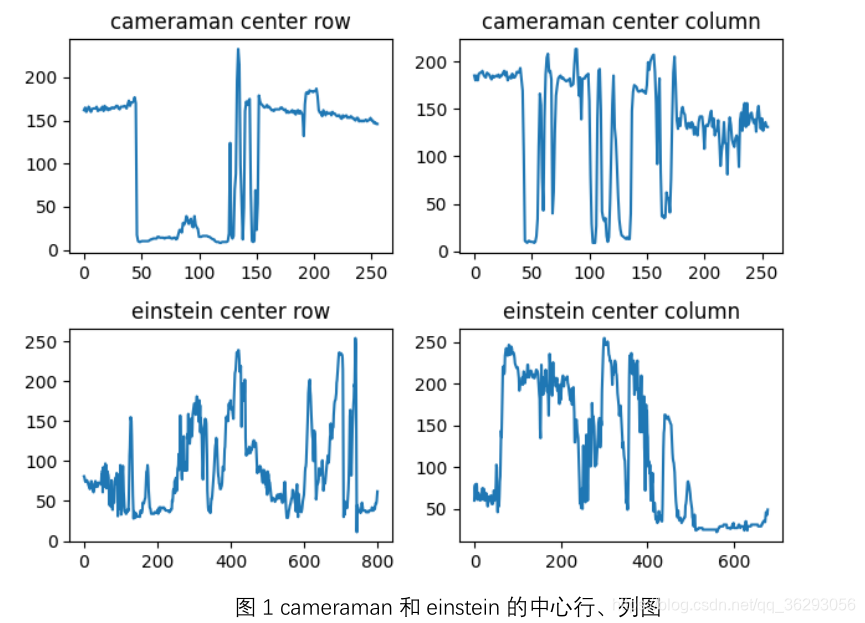
实现一个函数 s = scanLine4e(f, I, loc), 其中 f 是一个灰度图像,I 是一个整数,loc 是一个字符串。当 loc 为’row’时,I 代表行数。当 loc 为’column’时,I 代表列数。输出 s 是对应的相关行或者列的像素灰度矢量。调用该函数,提取 cameraman.tif 和 einstein.tif 的中心行和中心列的像素灰度矢量并将扫描得到的灰度序列绘制成图。
代码实现
导库
from PIL import Image
import numpy as np
import matplotlib.pyplot as plt
扫描函数
def  scanLine4e(f, I, loc):
    s = []
    if loc == 'row':
        for i in range(len(f[I,:])):
            s.append(f[I,i])
        return s

    elif loc == 'column':
        for i in range(len(f[:,I])):
            s.append(f[i,I])
        return s
    else:
        raise Exception("输入格式有误")
主函数
if __name__ == '__main__':
    # 导入第一张图片
    im1 = Image.open('cameraman.tif')
    im1 = np.array(im1)
    h1,w1 = im1.shape[0],im1.shape[1]
    # 调用函数提取中心行、列
    s11 = scanLine4e(im1,int(h1/2),'row')
    s12 = scanLine4e(im1,int(w1/2),'column')
    # 导入第二张图片
    im2 = Image.open('einstein.tif')
    im2 = np.array(im2)
    h2, w2 = im2.shape[0], im2.shape[1]
    s21 = scanLine4e(im2, int(h2 / 2), 'row')
    s22 = scanLine4e(im2, int(w2 / 2), 'column')
    #绘图
    plt.subplot(2, 2, 1)
    plt.plot(s11)
    plt.title('cameraman center row')
    plt.subplot(2, 2, 2)
    plt.plot(s12)
    plt.title('cameraman center column')
    plt.subplot(2, 2, 3)
    plt.plot(s21)
    plt.title('einstein center row')
    plt.subplot(2, 2, 4)
    plt.plot(s22)
    plt.title('einstein center column')
    plt.show()
运行结果


 1337
1337

 被折叠的 条评论
为什么被折叠?
被折叠的 条评论
为什么被折叠?
 到【灌水乐园】发言


