


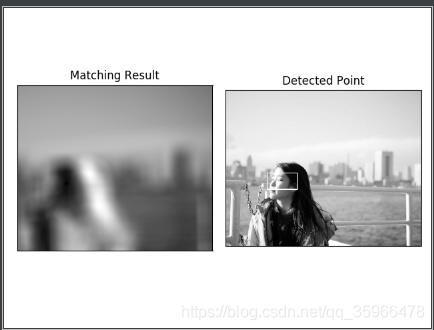
#使用函数cv2.matchTemplate()进行模板匹配.要求参数method的值设置为
#cv2.TM_SQDIFF,显示函数的返回结果以及匹配结果.
import cv2
import numpy as np
from matplotlib import pyplot as plt
img=cv2.imread('./image/iu.jpeg',0)
template=cv2.imread('./image/iuson.png',0)
th,tw=template.shape[::]
#模板匹配函数
rv=cv2.matchTemplate(img,template,cv2.TM_SQDIFF)
minVal,maxVal,minLoc,maxLoc=cv2.minMaxLoc(rv)
topLeft=minLoc
bottomRight=(topLeft[0]+tw,topLeft[1]+th)
cv2.rectangle(img,topLeft,bottomRight,255,2)
plt.subplot(121),plt.imshow(rv,cmap='gray')
plt.title('Matching Result'),plt.xticks([]),plt.yticks([])
plt.subplot(122),plt.imshow(img,cmap='gray')
plt.title('Detected Point'),plt.xticks([]),plt.yticks([])
plt.show()
输出:
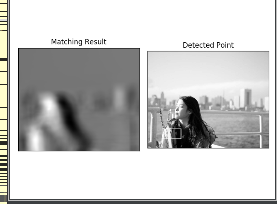
#使用cv2.matchTemplate()函数进行模板匹配,要求参数method的值
#设置为cv2.TM_CCOEFF,显示函数的返回结果及匹配结果
import cv2
import numpy as np
from matplotlib import pyplot as plt
img=cv2.imread('./image/iu.jpeg',0)
template=cv2.imread('./image/iuson.png',0)
tw,th=template.shape[::-1]
rv=cv2.matchTemplate(img,template,cv2.TM_CCOEFF)
minVal,maxVal,minLoc,maxLoc=cv2.minMaxLoc(rv)
topLeft=maxLoc
bottomRight=(topLeft[0]+tw,topLeft[1]+th)
cv2.rectangle(img,topLeft,bottomRight,255,2)
plt.subplot(121),plt.imshow(rv,cmap='gray')
plt.title('Matching Result'),plt.xticks([]),plt.yticks([])
plt.subplot(122),plt.imshow(img,cmap='gray')
plt.title('Detected Point'),plt.xticks([]),plt.yticks([])
plt.show()
输出:
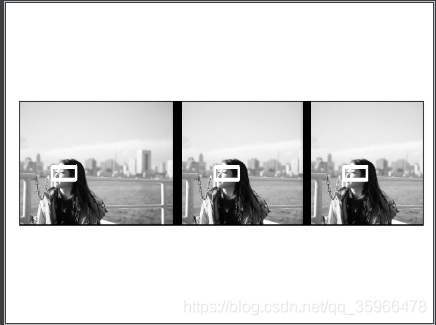
#使用模板匹配方式,标记在输入图像内与模板图像匹配的多个子图像
import cv2
import numpy as np
from matplotlib import pyplot as plt
img=cv2.imread('./image/iu3.png',0)
template=cv2.imread('./image/iuson.png',0)
w,h=template.shape[::-1]
res=cv2.matchTemplate(img,template,cv2.TM_CCOEFF_NORMED)
threshold=0.9
loc=np.where(res>=threshold)
for pt in zip(*loc[::-1]):
    cv2.rectangle(img,pt,(pt[0]+w,pt[1]+h),255,1)
plt.imshow(img,cmap='gray')
plt.xticks([]),plt.yticks([])
plt.show()
输出:


 324
324

 被折叠的 条评论
为什么被折叠?
被折叠的 条评论
为什么被折叠?
 到【灌水乐园】发言


