<!DOCTYPE html>
<html>
<head>
    <meta charset="utf-8">
    <script src="lib/echarts.js"></script>
<script src="lib/jquery-3.4.1.js"></script>
</head>
<body>
    <div id="main" style="width: 600px;height:400px;"></div>
    <div id="echartModel" style="width: 600px;height:400px;"></div>
    <script src="2.js"></script>
</body>
</html>
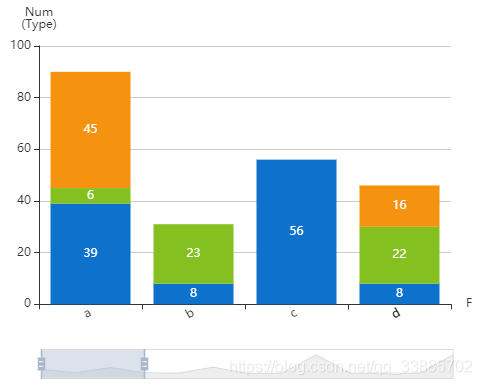
var json2 = '{"code": 200,"payload": [{"num": 39,"f": "a","type": "1"}, {"num": 6,"f": "a","type": "2"}, {"num": 8,"f": "b","type": "3"}, {"num": 45,"f": "a","type": "4"}, {"num": 56,"f": "c","type": "5"}, {"num": 8,"f": "d","type": "6"}, {"num": 4,"f": "e","type": "7"}, {"num": 22,"f": "d","type": "8"}, {"num": 60,"f": "f","type": "9"}, {"num": 1,"f": "g","type": "10"}, {"num": 3,"f": "e","type": "11"}, {"num": 4,"f": "e","type": "12"}, {"num": 23,"f": "b","type": "13"}, {"num": 3,"f": "e","type": "14"}, {"num": 3,"f": "h","type": "15"}, {"num": 4,"f": "e","type": "16"}, {"num": 16,"f": "d","type": "17"}, {"num": 177,"f": "i","type": "18"}, {"num": 3,"f": "77h","type": "19"}, {"num": 4,"f": "34e","type": "20"}, {"num": 3,"f": "11d","type": "21"}, {"num": 177,"f": "22i","type": "22"}, {"num": 3,"f": "77h","type": "23"}, {"num": 4,"f": "34e","type": "24"}, {"num": 3,"f": "11d","type": "25"}, {"num": 177,"f": "22i","type": "26"}]}';
let res = JSON.parse(json2).payload;
let mp = new Map();
for (let item of res) {
if (!mp.has(item.f)) {
mp.set(item.f, new Array());
}
mp.get(item.f).push({
type: item.type,
value: item.num
});
}
console.log(mp);
let xAixsData = [];
let seriesData = [];
let colorBag = ['#0e72cc', '#85c021', '#f59311', '#898989', '#a195c5', '#c82d31'];
let idx = 0;
for (let item of mp) {
xAixsData.push(item[0]);
let columnData = [];
for (let ano of mp) {
columnData.push(ano[1][idx]);
}
seriesData.push({
type: 'bar',
stack: 1,
data: columnData,
label: {
show: true,
},
itemStyle: {
normal: {
color: colorBag[idx % colorBag.length]
}
},
barMaxWidth: 80,
});
idx++;
}
console.log(xAixsData);
let option = {
grid: {
right: 100,
containLabel: true
},
dataZoom: [{
type: 'slider',
start: 0,
end: 25
}, {
type: 'inside',
}, ],
tooltip: {
trigger: 'axis',
axisPointer: {
type: 'shadow',
label: {
show: true,
backgroundColor: '#444141',
},
},
formatter: (params) => {
let res = '<div style="padding:0.1rem">' + params[0].name + '</div>';
for (let param of params) {
if (!param.data) continue;
res += param.marker + 'Type: ' + param.data.type + ' Num: ' + param.data.value + '<br>';
}
return res;
}
},
xAxis: [{
name: 'F',
type: 'category',
data: xAixsData,
axisLabel: {
interval: 0,
rotate: 30,
},
}],
yAxis: [{
name: 'Num\n(Type)',
type: 'value',
}],
series: seriesData
}
var myChart = echarts.init(document.getElementById('main'));
myChart.setOption(option);


 4638
4638

 被折叠的 条评论
为什么被折叠?
被折叠的 条评论
为什么被折叠?
 到【灌水乐园】发言


