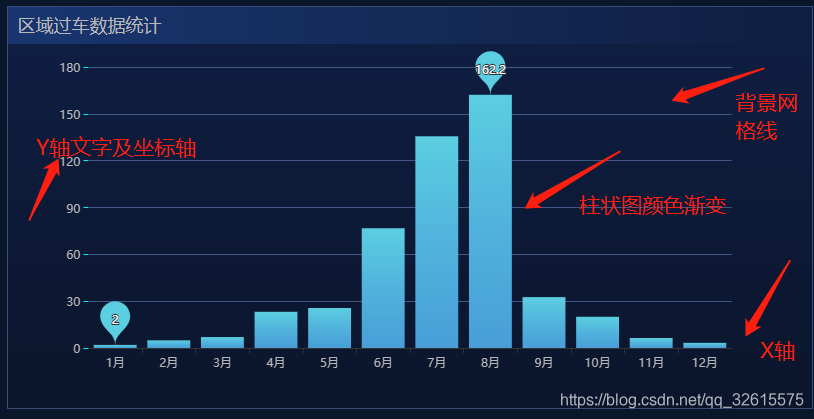
Echart在画图表经常使用的一些配置项
X轴Y轴及部分配置
tooltip: {
trigger: 'item',
formatter: "{a} <br/>{b} : {c}次 ({d}%)"
},
legend: {
show:false,
data: ["警员1", "警员2", "警员3"],
right: "30px",
y: "30px",
textStyle: {
color: "#b8b8b8"
}
},
color: ["#ff2d55", "#8ffa87", "#00c2ff"],
xAxis: [
{
type: "category",
axisLabel: {
textStyle: {
color: "#b8b8b8"
}
axisLabel:{
interval:0
},
},
axisLine:{
show:false,
lineStyle:{
color:'#00eeff',
},
},
boundaryGap: false,
data: ["周一", "周二", "周三", "周四", "周五", "周六", "周日"]
}
],
yAxis: [
{
splitLine:{
show:false,
},
show:false,
axisLabel: {
textStyle:{
color:'#7edae8',
},
},
axisLine:{
show:false,
lineStyle:{
color:'#00eeff',
},
},
axisTick:{
show:false,
},
},
],
series: {
name: "日用电量",
type: "bar",
smooth: true,
barWidth: 50,
data: data,
areaStyle: {
normal: {
color: new this.$echarts.graphic.LinearGradient(0, 0, 0, 1, [{
offset: 0,
color: 'rgba(60,177,228,0.5)'
},
{
offset: 1,
color: 'rgba(57,102,177,0.1)'
}
], false),
}
},
itemStyle: {
normal: {
color: function(params) {
var colorList = [
["#0679e3", "#3d97ed", "#90c1fc"],
["#07b8d9", "#62c4db", "#86e9fc"]
];
var index = params.dataIndex;
if (params.dataIndex >= colorList.length) {
index = params.dataIndex - colorList.length;
}
return new echarts.graphic.LinearGradient(0, 0, 0, 1, [
{ offset: 0, color: colorList[index][0] },
{ offset: 0.5, color: colorList[index][1] },
{ offset: 1, color: colorList[index][2] }
]);
},
barBorderRadius: 5
}
}
},
label: {
normal: {
show: true,
position: "top",
formatter: "{c}(kwh)"
}
},
textStyle: {
color: function(params) {
var colorList = ["#0679e3", "#07b8d9"];
return colorList[params.dataIndex];
},
fontWeight: 300,
fontSize: 16
},
grid: {
left: "20%",
right: "20%",
bottom: "8%",
containLabel: true
}
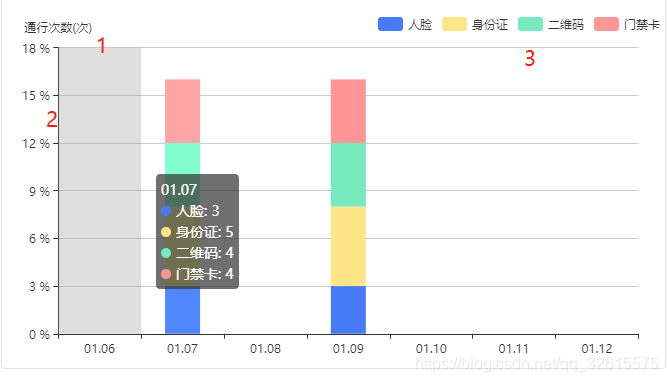
tooltip: {
trigger: 'axis',
axisPointer: {
type: 'shadow'
}
},
legend: {
left: 'right',
top: 'top',
data: nameList
},
grid: {
top:'10%',
left: '3%',
right: '4%',
bottom: '4%',
containLabel: true
},
xAxis: {
type: 'category',
data: data.time
},
yAxis: {
type: 'value',
axisLabel:{formatter:'{value} %'},
name:"通行次数(次)"
},
series:[
{
name: item.openTypeName,
type: 'bar',
stack: '总量',
barWidth: 35,
itemStyle:{normal:{color:colorList[index]}},
label: {
normal: {
show: false,
position: 'insideRight',
formatter:function(val){
console.log(val)
return val.name.split("-").join("\n");
}
},
},
data:item.countTime
}]
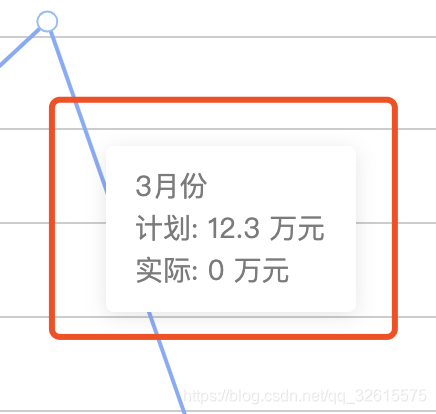
tooltip: {
trigger: 'axis',
axisPointer: {
type: 'none'
},
extraCssText: 'background-color:#fff;color:#7B7B7B;padding:10px 15px;box-shadow:0px 2px 10px 0px rgba(0,0,0,0.1);',
formatter(params) {
let {name, seriesName, value, unit = ''} = params[0] || {};
return `${params[0].name}月份<br />${params[0].seriesName}: ${formatter(params[0].value)} 万元<br />${params[1].seriesName}: ${formatter(params[1].value)} 万元`;
}
},
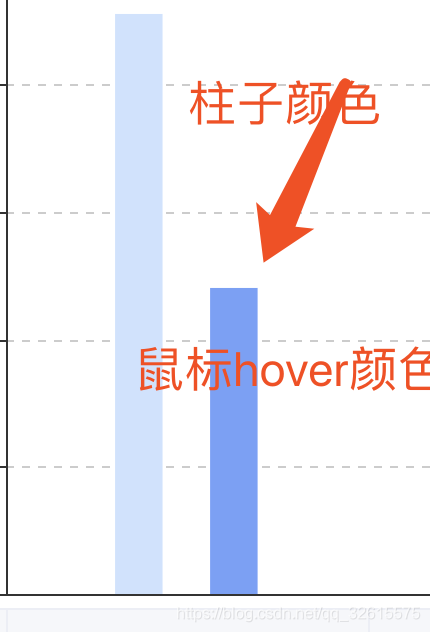
series: [{
data: [120, 200, 150, 80],
type: 'bar',
barCategoryGap:'80%',
itemStyle: {
color: '#62A1A9'
},
emphasis: {
itemStyle: {
color: '#2F4654',
borderWidth: 4,
borderColor: '#2F4654',
borderType: 'solid'
}
}]


 博客主要介绍了Echart在画图表时常用的一些配置项,以及X轴和Y轴的部分配置内容,聚焦于信息技术领域的前端可视化方面。


 1095
1095

 被折叠的 条评论
为什么被折叠?
被折叠的 条评论
为什么被折叠?
 到【灌水乐园】发言


