


 本文介绍了如何在Vue2项目中安装和使用vue-echarts来展示柱状图和饼图。首先,通过npm安装vue-echarts和@vue/composition-api。接着,在main.js全局注册vue-echarts组件。然后,在组件中分别展示了如何配置和渲染柱状图和饼图,包括数据转换和动态更新。示例代码详细展示了柱状图和饼图的配置选项,如x轴、y轴、系列和tooltip。
前言
这里使用的是vue2的版本
echarts 官网地址
vue-echarts GitHub地址
提示:以下是本篇文章正文内容
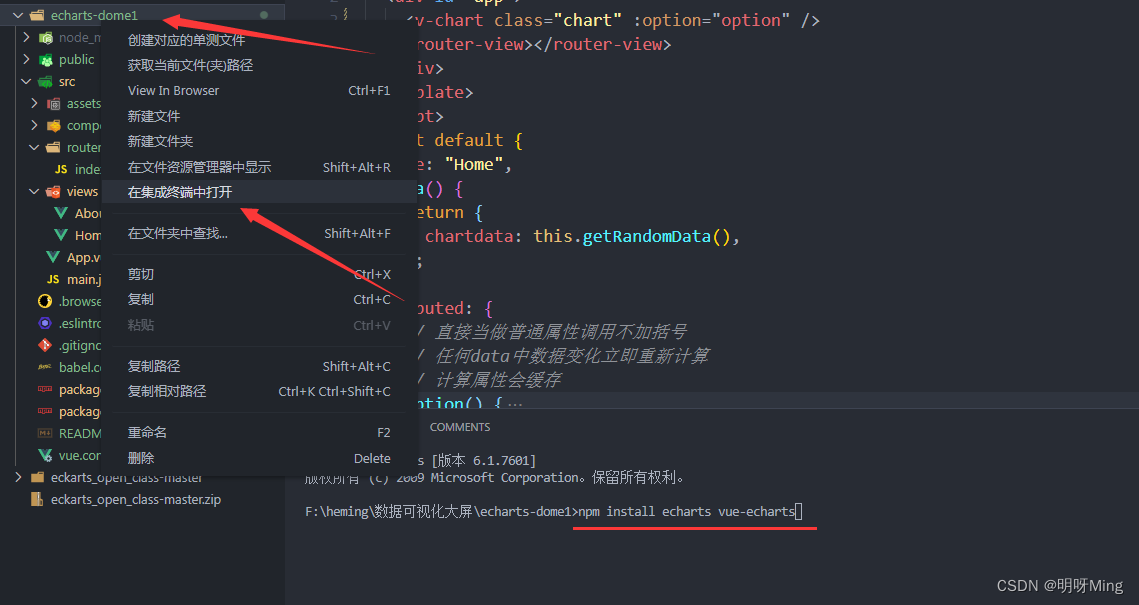
一、安装vue-echarts
我使用的是vue2版本所以要下载@vue/composition-api
要在 Vue 2 下使用 vue-echarts,需要确保 @vue/composition-api 已经安装
npm安装
npm install echarts vue-echarts
npm i -D @vue/composition-api
二、使用vue-echarts
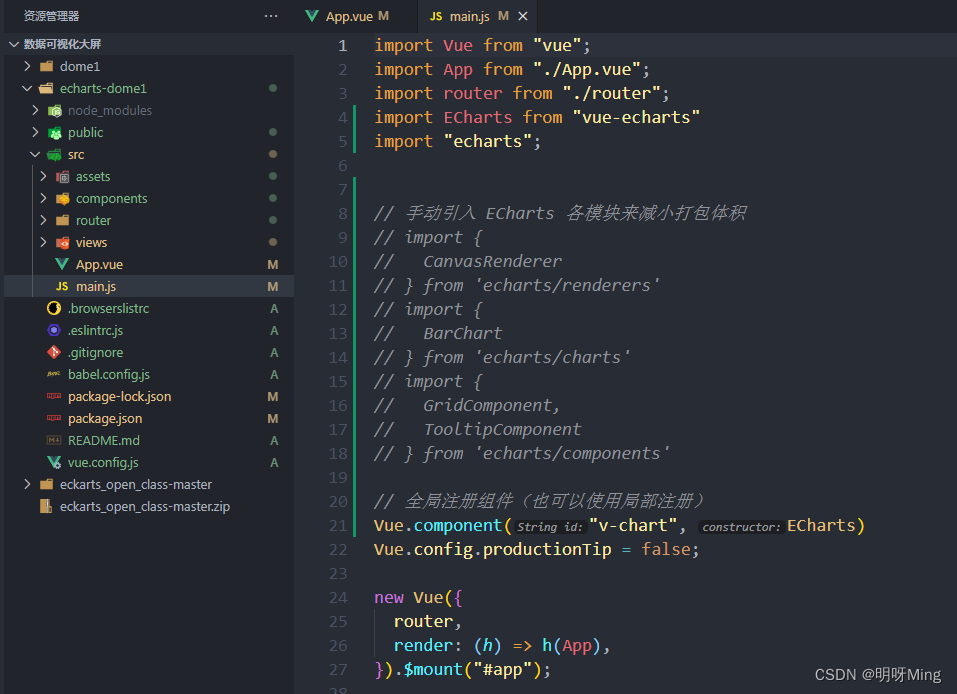
1.在main.js引入
import ECharts from 'vue-echarts'
// 引用全部模块
import "echarts";
// 手动引入 ECharts 各模块来减小打包体积
// import {
//   CanvasRenderer
// } from 'echarts/renderers'
// import {
//   BarChart
// } from 'echarts/charts'
// import {
//   GridComponent,
//   TooltipComponent
// } from 'echarts/components'

// 全局注册组件(也可以使用局部注册)
Vue.component('v-chart', ECharts)
main.js如下(示例):
2.在页面中使用 柱状图 bar
https://echarts.apache.org/examples/zh/editor.html?c=bar-simple
代码如下(示例):
<!-- 柱状图 -->
<template>
  <v-chart class="chart" :option="option" />
</template>
<script>
export default {
  name: "Home",
  data() {
    return {
      chartdata: this.getRandomData(),
    };
  },
  computed: {
    // 直接当做普通属性调用不加括号
    // 任何data中数据变化立即重新计算
    // 计算属性会缓存
    option() {
      return {
        xAxis: {
          type: "category",
          data: this.chartdata.map((d) => d.moon),
        },
        yAxis: {
          type: "value",
        },
        series: [
          {
          	//官网的data[120, 200, 150, 80, 70, 110, 130],
          	//通过map把请求回来的数据转换成组件需要的数据
            data: this.chartdata.map((d) => d.value),//[120, 200, 150, 80, 70, 110, 130]
            type: "bar",
            showBackground: true,
            backgroundStyle: {
              color: "rgba(180, 180, 180, 0.2)",
            },
          },
        ],
      };
    },
  },
  methods: {
   	// 模拟请求方法
    getRandomData() {
      return [
        {
          moon: "1月数据",
          value: Math.random() * 200,
        },
        {
          moon: "二月数据",
          value: Math.random() * 200,
        },
        {
          moon: "三月数据",
          value: Math.random() * 200,
        },
        {
          moon: "四月数据",
          value: Math.random() * 200,
        },
      ];
    },
  },
  created() {
  	// 每秒执行一次请求方法并渲染
    setInterval(() => (this.chartdata = this.getRandomData()), 1000);
  },
};
</script>
3.在页面中使用 饼图 pie
https://echarts.apache.org/examples/zh/editor.html?c=pie-borderRadius
<!-- 饼图 -->
<template>
  <v-chart class="chart" :option="option" />
</template>

<script>
export default {
  name: "Home",
  data() {
    return {
      chartdata: this.getRandomData(),
    };
  },
  computed: {
    // 直接当做普通属性调用不加括号
    // 任何data中数据变化立即重新计算
    // 计算属性会缓存
    option() {
      return {
        tooltip: {
          trigger: "item",
        },
        legend: {
          top: "5%",
          left: "center",
        },
        series: [
          {
            name: "Access From",
            type: "pie",
            radius: ["40%", "70%"],
            avoidLabelOverlap: false,
            itemStyle: {
              borderRadius: 10,
              borderColor: "#fff",
              borderWidth: 2,
            },
            emphasis: {
              label: {
                show: true,
                fontSize: "40",
                fontWeight: "bold",
              },
            },
            labelLine: {
              show: false,
            },
            data: this.getRandomData(),
          },
        ],
      };
    },
  },
  methods: {
    getRandomData() {
      //模拟请求返回来的数据格式
      let resData = [
        {
          name: "Search",
          num: Math.random() * 100,
        },
        {
          name: "Direct",
          num: Math.random() * 100,
        },
        {
          name: "Email",
          num: Math.random() * 100,
        },
        {
          name: "Union",
          num: Math.random() * 100,
        },
        {
          name: "Video",
          num: Math.random() * 100,
        },
      ];
      //转换我们需要的数据
      return resData.map((item) => {
        return { value: item.num, name: item.name };
      });
    },
  },
  created() {
    setInterval(() => (this.chartdata = this.getRandomData()), 1000);
  },
};
</script>
总结
以上就是vue使用Vue-Echarts的内容,通过api请求返回来的数据.map方法转换成Echarts图表所使用的数据


 被折叠的 条评论
为什么被折叠?
被折叠的 条评论
为什么被折叠?
 到【灌水乐园】发言


