


 本文详细介绍如何通过三步配置实现PHP Xdebug调试,包括php.ini文件设置、IDE配置及Chrome插件安装,确保开发者能顺利进行代码调试。
总体分为三步:
2 1.配置本地php.ini文件
在php.ini中添加Xdebug配置
[Xdebug]
zend_extension=C:/d/phpstudy_pro/Extensions/php/php7.3.4nts/ext/php_xdebug.dll
xdebug.remote_enable=On
xdebug.remote_host=localhost
xdebug.remote_port=9000
xdebug.collect_params=1
xdebug.collect_return=1
xdebug.auto_trace=On
xdebug.trace_output_dir=C:/d/phpstudy_pro/Extensions/php_log/php7.3.4nts.xdebug.trace
xdebug.profiler_enable=On
xdebug.profiler_output_dir=C:/d/phpstudy_pro/Extensions/php_log/php7.3.4nts.xdebug.profiler
xdebug.remote_handler=dbgp
然后用php -v 命令看一下,如下图就算配置成功了
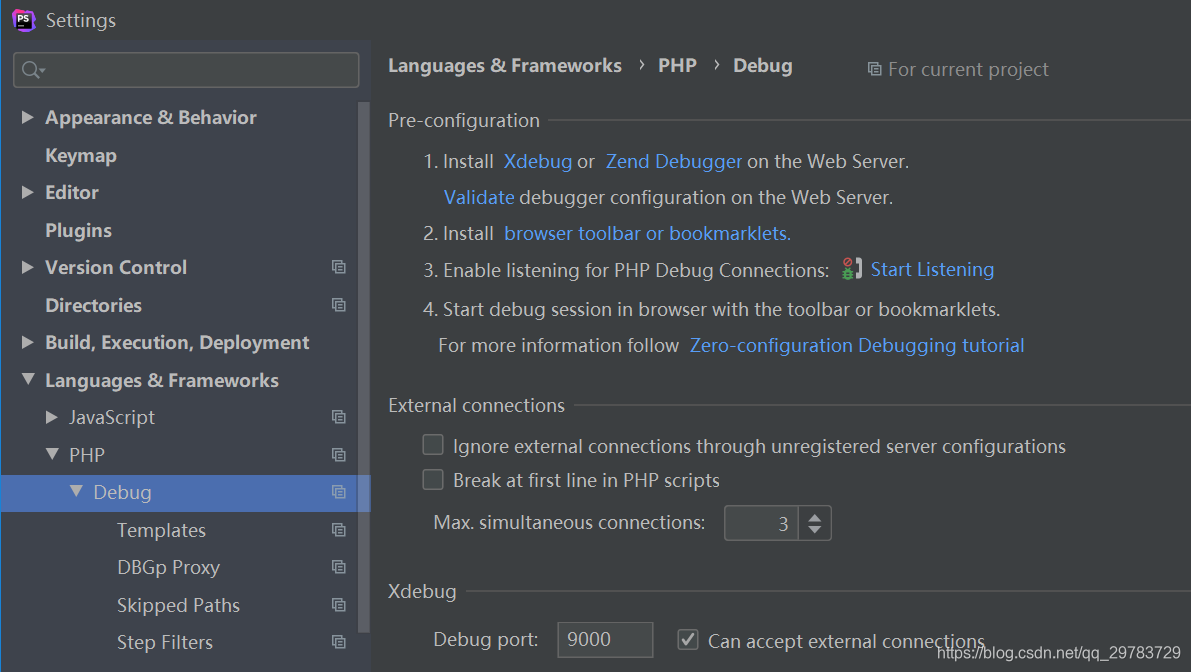
2.修改IDE配置
端口配置和php.ini中 xdebug.remote_port=9000一致
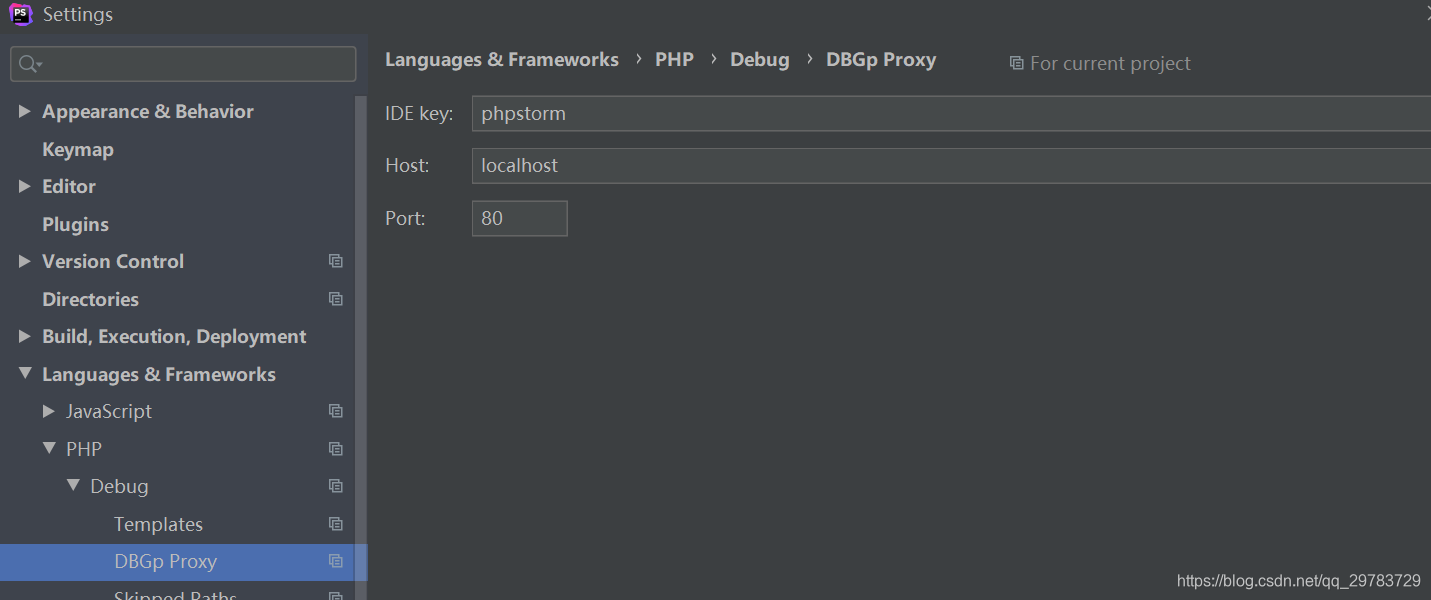
这里主要是配置一个key,端口随意添一个也能用。。。。
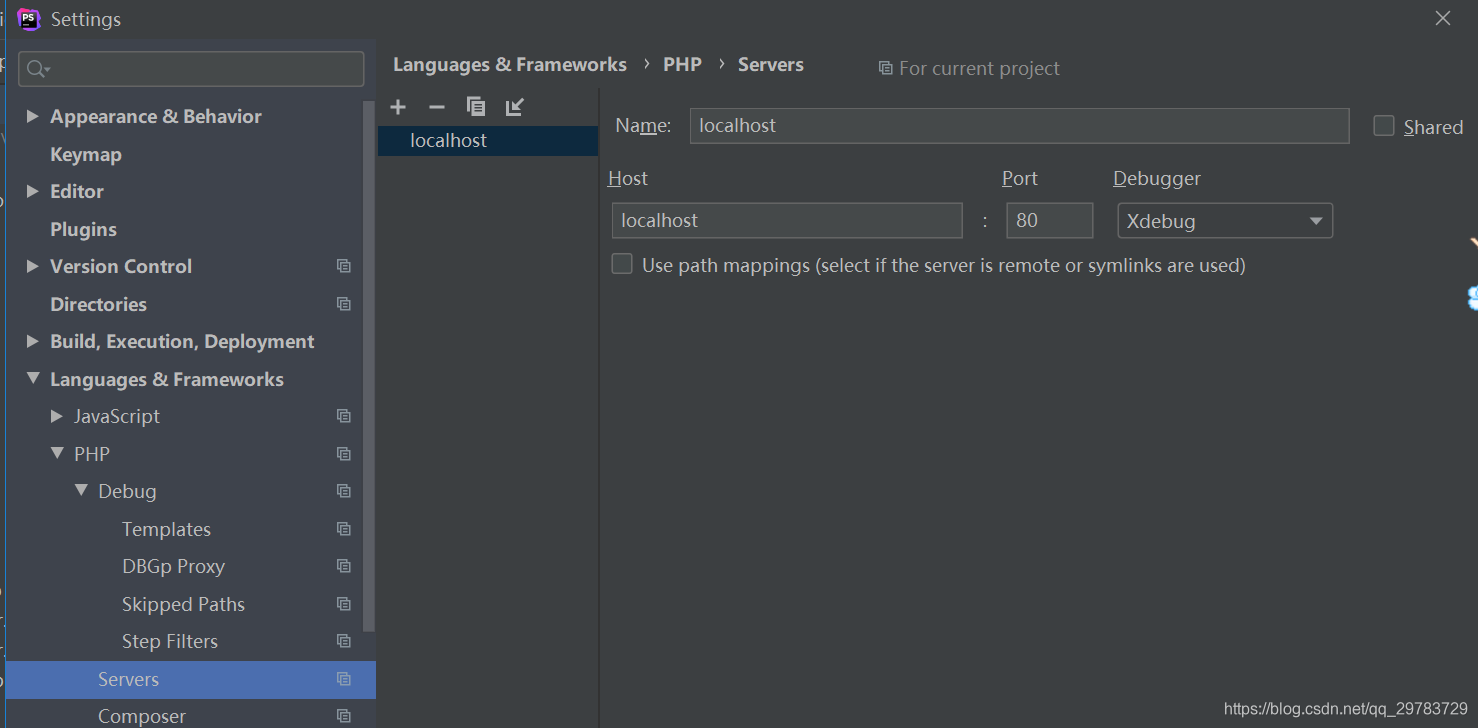
配置域名和网站的端口
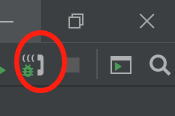
###右上角打开监听 ,变成下图这样就可以了
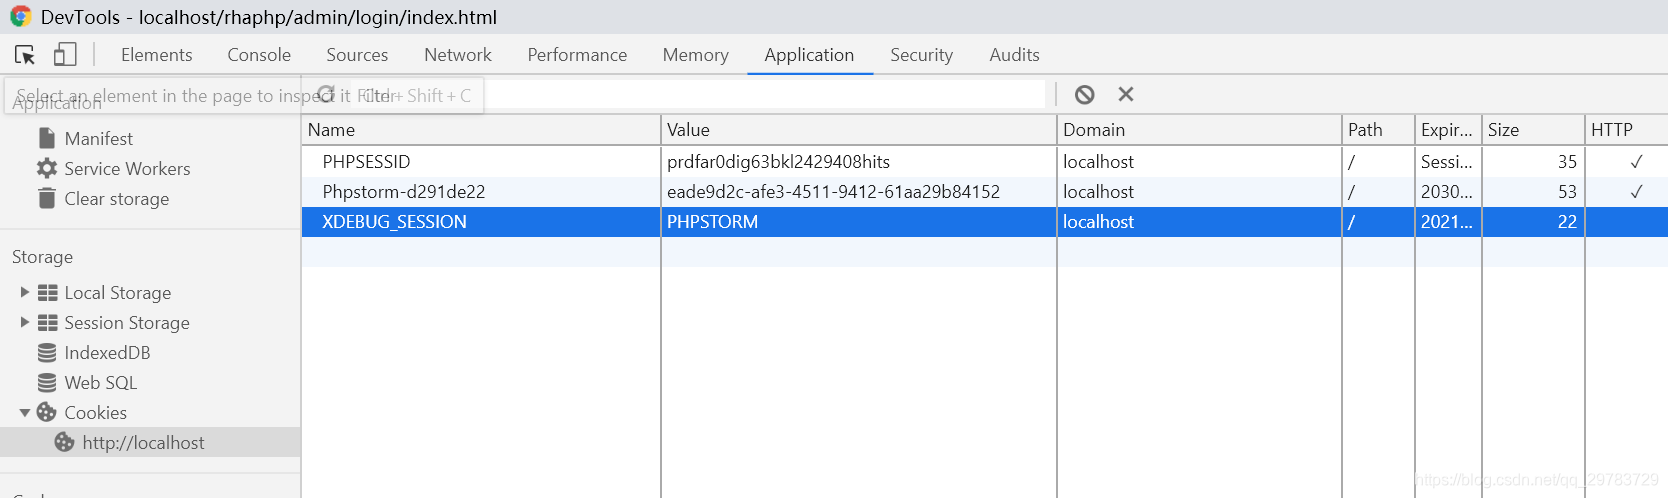
3.安装chrome浏览器插件
其实不装插件也可以,主要是为了在cookie中生成一个值,和IDE能对上,如下图
在程序里加上断点
如果你没有装插件的,就这样玩吧
http://网站地址??XDEBUG_SESSION_START=PHPSTORM
cookie就会自动添加key


 1050
1050

 被折叠的 条评论
为什么被折叠?
被折叠的 条评论
为什么被折叠?
 到【灌水乐园】发言


