


 该博客介绍了如何使用AntV G6库来控制流程图中的节点显示和隐藏,以及如何为指定节点添加颜色。通过点击操作,可以实现节点4及其相关边的隐藏和显示,并展示了相应的代码示例。
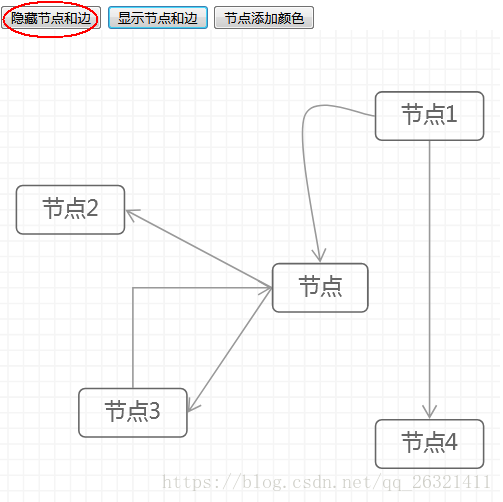
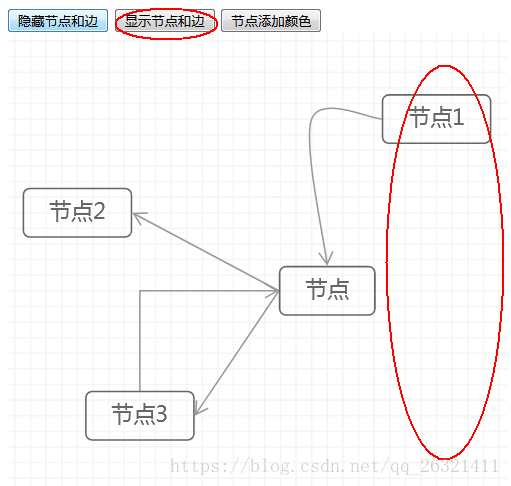
1、点击隐藏,控制隐藏节点4以及相关的边
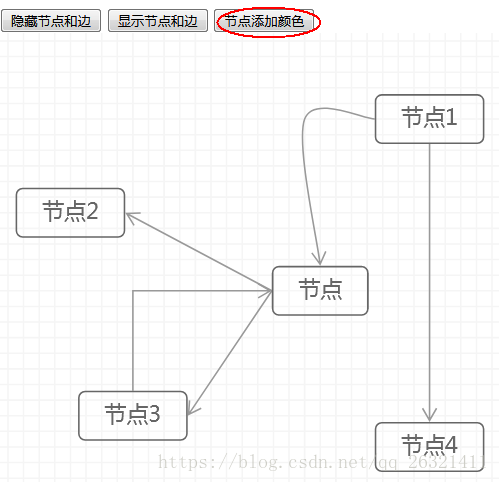
2、点击显示,显示节点4以及相关的边
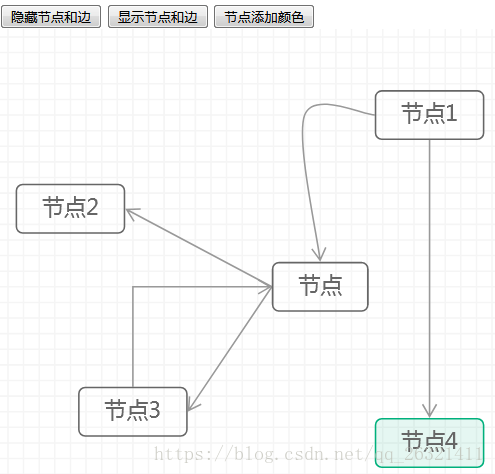
3、点击添加颜色,给指定节点4添加颜色
demo如下:
<!DOCTYPE html>
<html><head>
<meta charset="utf-8">
<title>节点方法</title>
<script src="https://a.alipayobjects.com/jquery/jquery/1.11.1/jquery.js"></script>
<script src="https://gw.alipayobjects.com/as/g/datavis/g6/1.1.6/index.js"></script>
</head>
<body>
<div id="c1"></div>
<script type="text/javascript">
$('body').prepend('<button id="getEdges">隐藏节点和边</button> <button id="getLinkNodes">显示节点和边</button> <button id="getUnLinkNodes">节点添加颜色</button> ')
var Util = G6.Util;
// 第三步:设置数据
var data = {
"source": {
"nodes": [
{
"shape": "rect",
"label": "节点",
"id": "keyNode",
"x": 710,
"y": 260,
"color": "#FF9D2D"
},
{
"shape": "rect",
"label": "节点1",
&n
 最低0.47元/天 解锁文章


 906
906

 被折叠的 条评论
为什么被折叠?
被折叠的 条评论
为什么被折叠?
 到【灌水乐园】发言


