


<template>
  <div>
    <div :id="radarChart"
         style="width:350px;height:280px"></div>
  </div>
</template>
<script>
import * as echarts from 'echarts'
const idGen = () => {
  return new Date().getTime()
}
export default {
  props: {
    options: {
      type: Object,
      default: null
    },
    color: {
      type: String,
      default: 'rgb(155, 191, 253)'
    },
  },
  name: 'RadarChart',
  data () {
    return {
      radarChart: null
    }
  },
  mounted () {
    setTimeout(() => {
      this.renderEcharts();
    }, 500);
  },
  created () {
    this.radarChart = idGen()
  },
  watch: {
    options: {
      immediate: true,
      deep: true,
      handler (val) {
        this.options = val;
        // let _this = this
        // _this.renderEcharts();
        setTimeout(() => {
          // debugger
          this.renderEcharts();
        }, 500);
      }
    },
    // options (val) {
    //   this.options = val;
    //   setTimeout(() => {
    //     this.renderEcharts();
    //   }, 500);
    // },
  },
  methods: {
    renderEcharts () {
      var roseCharts = document.getElementById(this.radarChart);
      var myChart = echarts.init(roseCharts);
      var xDataArr = [];
      // debugger
      this.options.xDataArr.forEach((value, index) => {
        xDataArr.push({ name: value, max: 100 })
      });
      var option = {
        radar: {
          indicator: xDataArr,
          name: {
            textStyle: {
              fontSize: 15,
              color: '#333333'
            }
          },

        },
        series: [
          {
            //这里的配置显示数值
            label: {
              normal: {
                show: true,
                textStyle: {
                  color: this.color //雷达图数值颜色
                },
                formatter: function (params) {
                  return params.value;
                }
              },

            },
            type: 'radar',
            areaStyle: {

              normal: {
                color: this.color //改变区域颜色
              }
            },//背景色显示
            itemStyle: {
              normal: {
                color: this.color, //改变折线点的颜色
                lineStyle: {
                  color: this.color //改变折线颜色
                }
              }
            },
            data: [
              {
                // value: [70, 60, 100, 55, 75],
                value: this.options.yDataArr,
              }
            ]
          }
        ]
      };
      myChart.setOption(option);

    },
  }
}
</script>

<style scoped>
</style>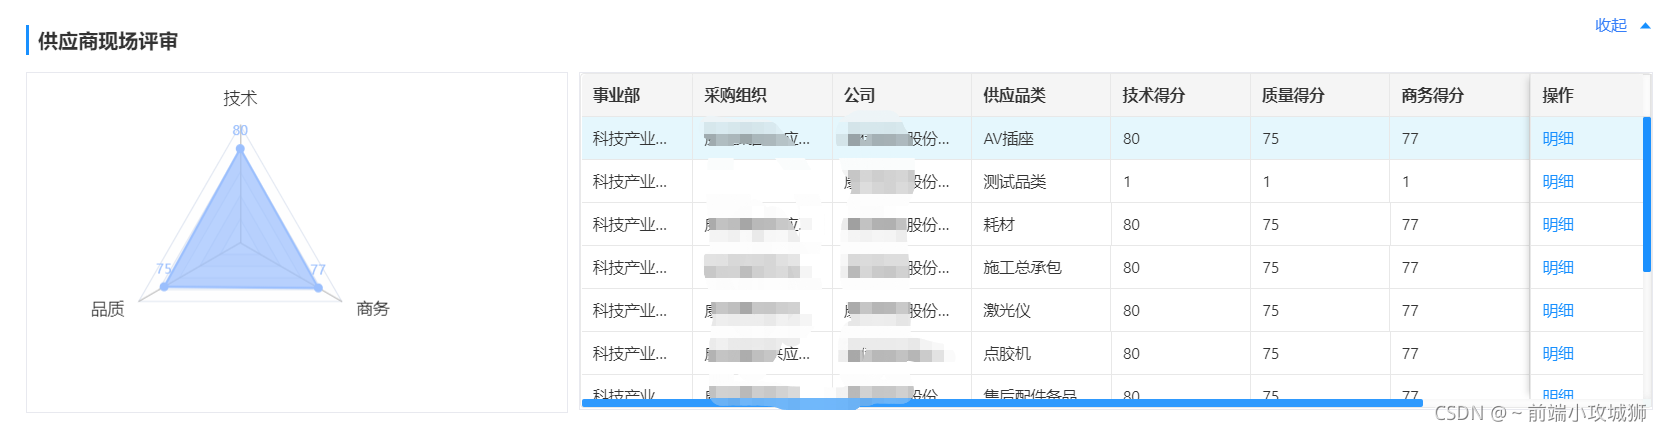
点击切换表格某一行,雷达图数据切换代码实现参考,主要是:customRow="rowClick"方法
    <a-table :scroll="{ x: 1200, y: 260 }"
                     size="small"
                     :customRow="rowClick"
                     :columns="tableHeader.siteReviewHeader"
                     :dataSource="tableDataSource.siteReviewList"
                     :pagination="false"
                     :bordered="true">
            </a-table>
rowClick (record, index) {
return {
style: {
// 背景颜色
'background-color': index === this.customKey ? 'rgb(0, 180, 237,0.1)' : ''
},
on: {
click: () => {
// 当前点击的行
this.customKey = index;
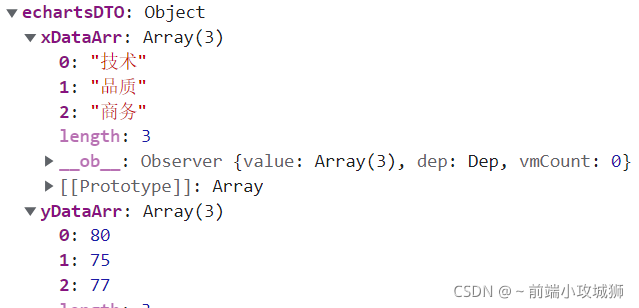
this.radarList = record.echartsDTO;//后端数据赋值到雷达图
}
}
}
},<RadarChart :options="radarList"
:color="color">//也可以传color改变颜色再赋一个后端传过来的x,y轴数据图


 被折叠的 条评论
为什么被折叠?
被折叠的 条评论
为什么被折叠?
 到【灌水乐园】发言


