


分享一个终端terminal可视化工具youplot,经测试在linux和mac下可用。
youplot安装
conda install -c conda-forge ruby
conda install -c conda-forge compilers
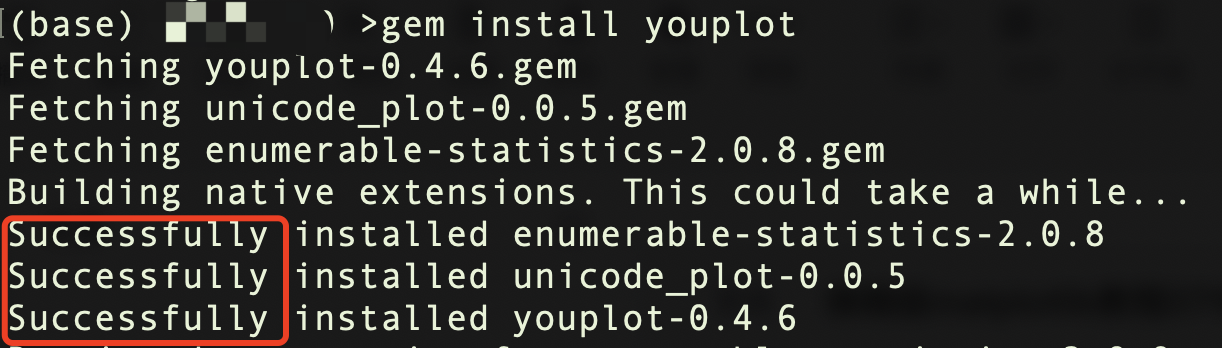
gem install youplot出现如下字样表示youplot安装成功,
youplot使用
youplot使用非常简单,可以和python、aw、csvtk等完美结合,例如barplot,
curl -sL https://git.io/ISLANDScsv \
| sort -nk2 -t, \
| tail -n15 \
| uplot bar -d, -t "Areas of the World's Major Landmasses"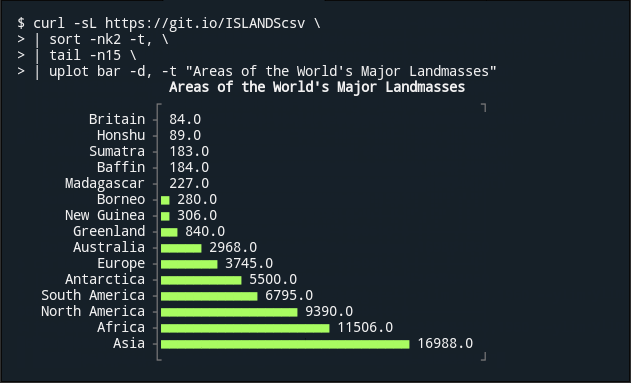
histplot,
echo -e "from numpy import random;" \
        "n = random.randn(10000);"  \
        "print('\\\n'.join(str(i) for i in n))" \
| python3 \
| uplot hist --nbins 20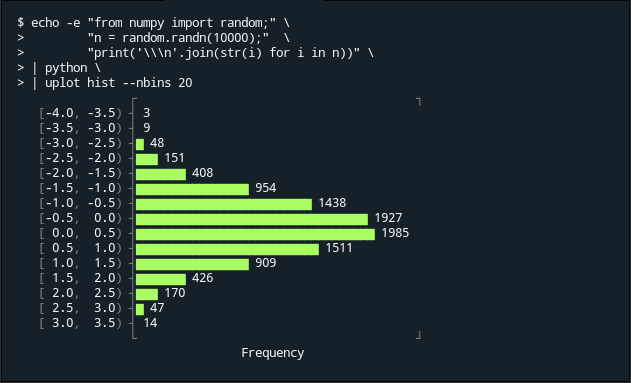
conutplot,
cat gencode.v35.annotation.gff3 \
| grep -v '#' | grep 'gene' | cut -f1 \
| uplot count -t "The number of human gene annotations per chromosome" -c blue 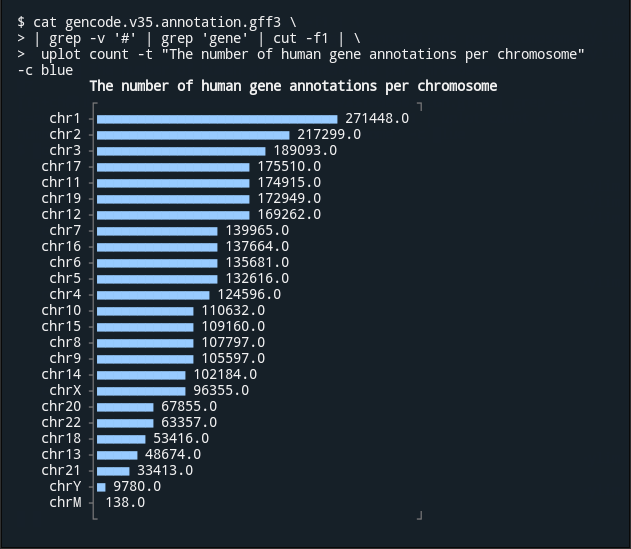


 6万+
6万+

 被折叠的 条评论
为什么被折叠?
被折叠的 条评论
为什么被折叠?
 到【灌水乐园】发言


