


TSpectrum2类是二维谱类,其中的方法可以寻找在二维直方图(即散点图)内的峰个数。本篇文章会介绍部分该类的基本用法和原理。
一、基本简介
根据官网介绍,TSpectrum类以及TSpectrum2类是遗留代码,其在以后的ROOT版本中已经不再继续维护,但仍可使用。该类在《ROOTUsersGuide》也未列出,因此只能查看官网的电子文档来获取相关信息。以下引自官网声明:
Legacy Code
The Spectrum package is a legacy interface: it is not recommended to use it in new code. There will be no bug fixes nor new developments.
关于各种电子文档的查阅,各位读者可以尝试在ROOT Manual - ROOT该链接中查找,还请读者自己探索。而本文提及的TSpectrum类和TSpectrum2类可以在ROOT: Advanced spectra processing classes.之中找到。网站中使用的范例代码和数据,各位均可以在$ROOTSYS/tutorials/下找到。
二、寻峰代码
1、方法SearchHighRes的信息
Int_t TSpectrum2::SearchHighRes 	( 	Double_t **  	source,
		Double_t **  	dest,
		Int_t  	ssizex,
		Int_t  	ssizey,
		Double_t  	sigma,
		Double_t  	threshold,
		Bool_t  	backgroundRemove,
		Int_t  	deconIterations,
		Bool_t  	markov,
		Int_t  	averWindow
	)
这是二维寻峰的核心方法的函数原型,简单介绍一下各个参数:(翻译可能不准确,有些参数还未完全弄懂)
- source - 指向源谱矩阵的指针
- dest - 指向解反卷积谱矩阵的指针
- ssizex - 源谱x轴长度
- ssizey - 源谱y轴长度
- sigma - 搜索峰值的sigma,详细信息请参考手册(关于手册中的补充:峰值中心的值 [ i ] 减去两个对称的channel长度(channels i-3*sigma, i+3*sigma)的平均值必须大于阈值threshold。 否则峰值将被忽略。可以近似理解为正态分布中的sigma。)
- threshold - 所选峰值的阈值,幅度小于threshold*highest_peak/100的峰将被忽略,参见手册
- backgroundRemove - 逻辑变量,设置是否需要在反卷积之前去除背景
- deconIterations - 反卷积操作中的迭代次数
- markov - 逻辑变量,如果为真,首先将源谱替换为使用马尔可夫链方法计算的新谱。
- averWindow - 搜索峰值的平均窗口,详见手册(仅适用于马尔可夫链方法)
为了防止歧义,把原英文描述贴在下面:
- source-pointer to the matrix of source spectrum
- dest-pointer to the matrix of resulting deconvolved spectrum
- ssizex-x length of source spectrum
- ssizey-y length of source spectrum
- sigma-sigma of searched peaks, for details we refer to manual
- threshold-threshold value in % for selected peaks, peaks with amplitude less than threshold*highest_peak/100 are ignored, see manual
- backgroundRemove-logical variable, set if the removal of background before deconvolution is desired
- deconIterations-number of iterations in deconvolution operation
- markov-logical variable, if it is true, first the source spectrum is replaced by new spectrum calculated using Markov chains method.
- averWindow-averaging window of searched peaks, for details we refer to manual (applies only for Markov method)
2、分类介绍
以下介绍该代码使用示例为上述网址内的,Example 8 - Src.C。我们分三个部分介绍。
#include <TSpectrum2.h>

void Src() {
   Int_t i, j, nfound;
   const Int_t nbinsx = 64;
   const Int_t nbinsy = 64;
   Double_t xmin = 0;
   Double_t xmax = (Double_t)nbinsx;
   Double_t ymin = 0;
   Double_t ymax = (Double_t)nbinsy;
   Double_t** source = new Double_t*[nbinsx];
   for (i=0;i<nbinsx;i++)
      source[i]=new Double_t[nbinsy];
   Double_t** dest = new Double_t*[nbinsx];
   for (i=0;i<nbinsx;i++)
      dest[i]=new Double_t[nbinsy];
   TString dir  = gROOT->GetTutorialDir();
   TString file = dir+"/spectrum/TSpectrum2.root";
   TFile *f     = new TFile(file.Data());
   gStyle->SetOptStat(0);
   auto search = (TH2F*) f->Get("search4");
   auto *s = new TSpectrum2();
   for (i = 0; i < nbinsx; i++){
      for (j = 0; j < nbinsy; j++){
         source[i][j] = search->GetBinContent(i + 1,j + 1);
      }
   }

/**************************************************************************************/

   nfound = s->SearchHighRes(source, dest, nbinsx, nbinsy, 2, 5, kTRUE, 3, kFALSE, 3);

/**************************************************************************************/

   printf("Found %d candidate peaks\n",nfound);
   Double_t *PositionX = s->GetPositionX();
   Double_t *PositionY = s->GetPositionY();
   search->Draw("COL");
   auto m = new TMarker();
   m->SetMarkerStyle(23);
   m->SetMarkerColor(kRed);
   for (i=0;i<nfound;i++) {
      printf("posx= %d, posy= %d, value=%d\n",(Int_t)(PositionX[i]+0.5), (Int_t)(PositionY[i]+0.5),
      (Int_t)source[(Int_t)(PositionX[i]+0.5)][(Int_t)(PositionY[i]+0.5)]);
      m->DrawMarker(PositionX[i],PositionY[i]);
   }
}
1、声明部分
Int_t i, j, nfound;
   const Int_t nbinsx = 64;//it is the same as source spectrum
   const Int_t nbinsy = 64;//it is the same as source spectrum
   Double_t xmin = 0;
   Double_t xmax = (Double_t)nbinsx;
   Double_t ymin = 0;
   Double_t ymax = (Double_t)nbinsy;
   Double_t** source = new Double_t*[nbinsx];
   for (i=0;i<nbinsx;i++)
      source[i]=new Double_t[nbinsy];
   Double_t** dest = new Double_t*[nbinsx];
   for (i=0;i<nbinsx;i++)
      dest[i]=new Double_t[nbinsy];
   TString dir  = gROOT->GetTutorialDir();
   TString file = dir+"/spectrum/TSpectrum2.root";
   TFile *f     = new TFile(file.Data());//you can change this root filename
   gStyle->SetOptStat(0);
   auto search = (TH2F*) f->Get("search4");//you can change this histogram name
   auto *s = new TSpectrum2();
   for (i = 0; i < nbinsx; i++){
      for (j = 0; j < nbinsy; j++){
         source[i][j] = search->GetBinContent(i + 1,j + 1);
      }
   }
SearchHighRes()中的source, dest, nbinsx, nbinsy在此处被定义,其中大部分无需我们修改。我们可以操作的参数只有nbinsx和nbinsy,其与源谱应保持一致。它的含义是,对粒子谱的x轴的0-64和y轴的0-64的区域内进行寻峰。注意:1、nbinsx和nbinsy的上限是100。也就是说最大搜索区间是0-100。2、强调其搜索区间是大于零的,只能在第一象限。(这是笔者多次尝试后得到的结果,如果读者发现错误,还请指正。)3、该方法source指向一个二维直方图TH2F类(对于该示例指向search4)。故如果源谱的坐标轴范围超出了100,则需要对填充二维直方图的各个粒子坐标进行数学变换,使其压缩到0-100的范围内。因此源谱的轴范围上限是多少,两个参数的值即为多少。
除注释外,以上结构无需变动。读者可以到前文提到的网址或root的文件夹下查看其他示例来总结不变的代码框架是什么,实际上就是共有的代码部分。
2、核心部分
nfound = s->SearchHighRes(source, dest, nbinsx, nbinsy, 2, 5, kTRUE, 3, kFALSE, 3);该核心部分的各参数含义已经在上文提及过了。出去前面声明部分已经定义了一部分参数,现在在该语句中我们可以操作的参数有sigma,threshold,backgroundRemove,deconlterations,markov,averWindow。
其中backgroundRemove与deconlterations共同使用。前者为KTRUE时,后者的数值才有意义。该迭代次数越多,可以认为对背景的去除越强,同时可能让一些微小的峰变得显著。
其中markov与averWindow共同使用。前者为KTRUE时,后者的数值才有意义。开启马尔科夫链算法后,源谱会被一个更加平滑的谱所替代,可以有效降低源谱的躁动和“参差程度”。平均窗口数值越大,生成的新谱越光滑。
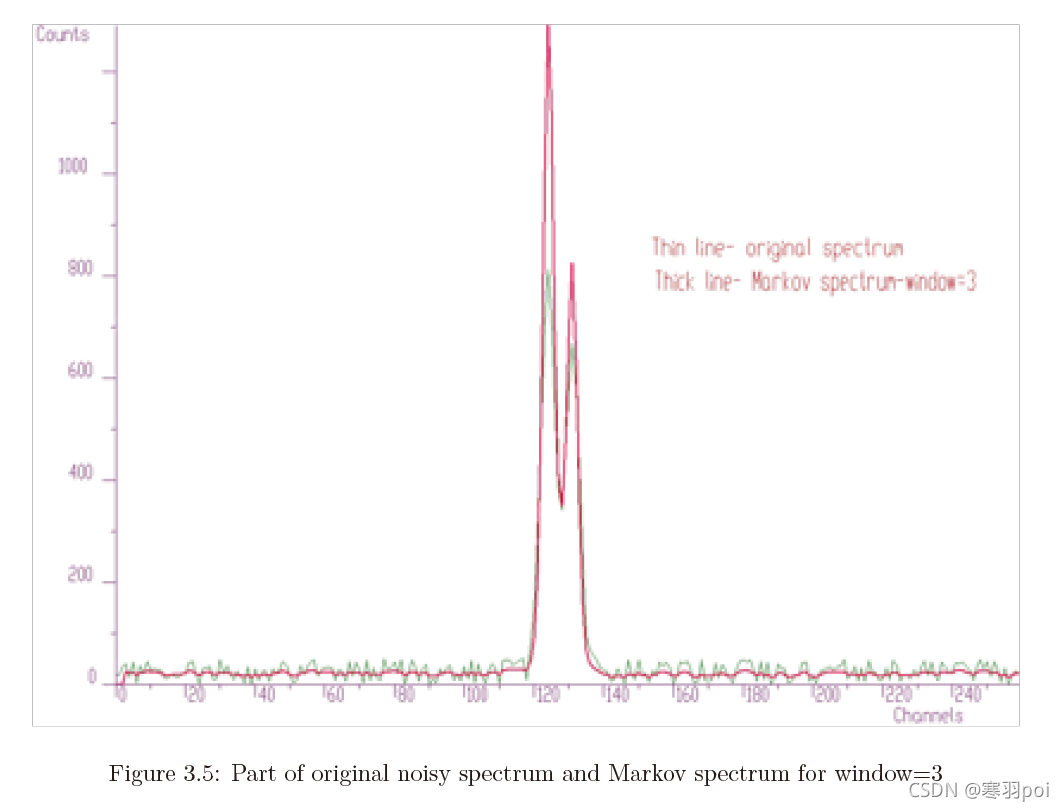
如上图所示,红色线为马尔科夫链算法生成的新谱(此示例为一维谱),其波动远小于绿色的源谱,变得更加平滑。图片引自官方出具的手册《Spectrum》。
该函数返回寻峰的个数(Int_t类型),此代码用指针s访问其返回值并赋值给nfound。对于该函数的一组参数,其结果可能只对具有某类特征的峰显著性和正确性,因此在面对不同情况的源谱时,需要先调参以确保结果正确。
3、绘图部分
   printf("Found %d candidate peaks\n",nfound);
   Double_t *PositionX = s->GetPositionX();
   Double_t *PositionY = s->GetPositionY();
   search->Draw("COL");
   auto m = new TMarker();
   m->SetMarkerStyle(23);
   m->SetMarkerColor(kRed);
   for (i=0;i<nfound;i++) {
      printf("posx= %d, posy= %d, value=%d\n",(Int_t)(PositionX[i]+0.5), (Int_t)(PositionY[i]+0.5),
      (Int_t)source[(Int_t)(PositionX[i]+0.5)][(Int_t)(PositionY[i]+0.5)]);
      m->DrawMarker(PositionX[i],PositionY[i]);
设置了一些绘图的输出设置。无需改动。如果只想知道SearchHighRes()的返回值,则可以把该模块全部删除,仅输出nfound即可。可以减小图形开销。当然,更加直观的图片结果更有利于程序员来判断代码的正误,进行调试。因此在对SearchHighRes()调参时,最好保留该模块。
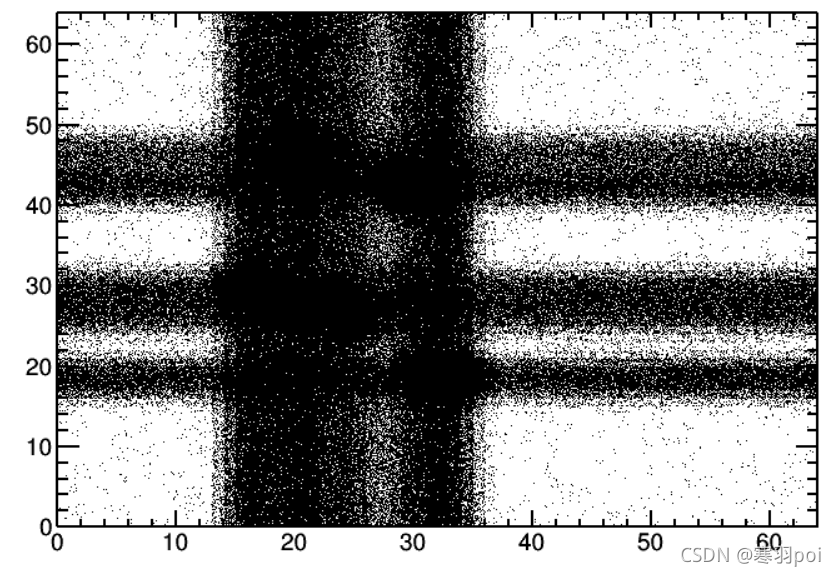
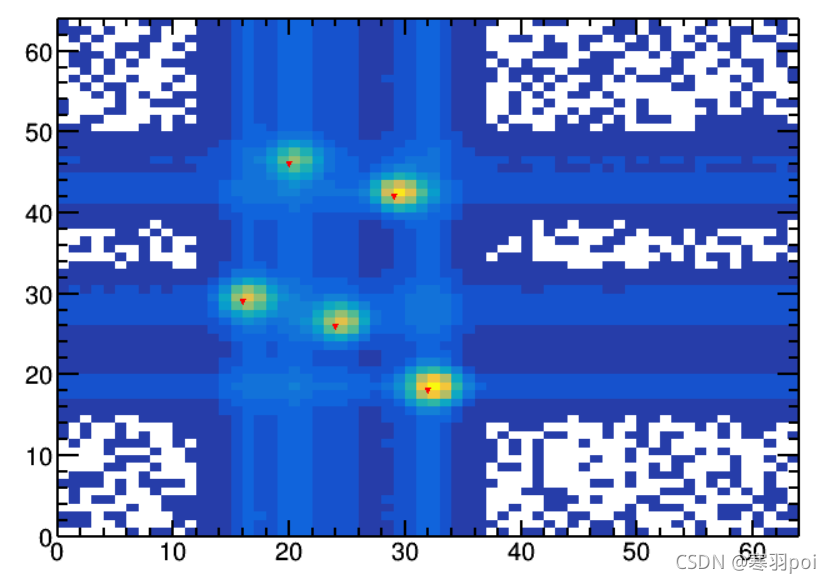
以下两张图分别是源谱和寻峰后的生成谱,其中红色三角标识是寻到的峰位。
有关于TSpectrum2类的寻峰代码介绍到这。简单介绍,如需学习,还请各位查阅前文提到的官方网站和官方出具的手册进行学习
【资料】
1、ROOT官网——ROOT: analyzing petabytes of data, scientifically. - ROOT
2、ROOT官方扩展手册——《Spectrum》
如有错误请指正。


 546
546

 被折叠的 条评论
为什么被折叠?
被折叠的 条评论
为什么被折叠?
 到【灌水乐园】发言


