import numpy as np
import matplotlib as mpl
import matplotlib.pyplot as plt
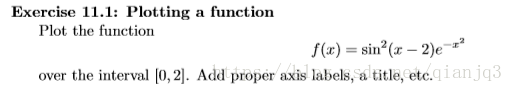
x = np.linspace(0,2,100)
y = np.power(np.sin(x-2),2)*np.exp((-1)*np.power(x,2))
fig = plt.figure()
axes = fig.add_axes([0.1,0.1,0.8,0.8])
axes.plot(x,y)
axes.set_xlabel('x')
axes.set_ylabel('y')
axes.set_xlim((0,2))
axes.set_ylim((0,1))
axes.set_title('Exercise 11.1')
plt.show()
>>> import numpy as np
>>> import matplotlib as mpl
>>> import matplotlib.pyplot as plt
>>> X = np.random.rand(20,10)
>>> b = np.random.rand(10,1)
>>> z = np.random.rand(20,1)
>>> y = np.dot(X,b)+z
>>> D = np.dot(np.transpose(X),X)
>>> d = np.dot(np.transpose(X),y)
>>> _b = np.dot(np.linalg.inv(D),d)
>>> a = np.linspace(0,9,10)
>>> fig,axes = plt.subplots()
>>> ax.grid(linestyle='-')
Traceback (most recent call last):
File "<pyshell#38>", line 1, in <module>
ax.grid(linestyle='-')
NameError: name 'ax' is not defined
>>> axes.grid(linestyle='-')
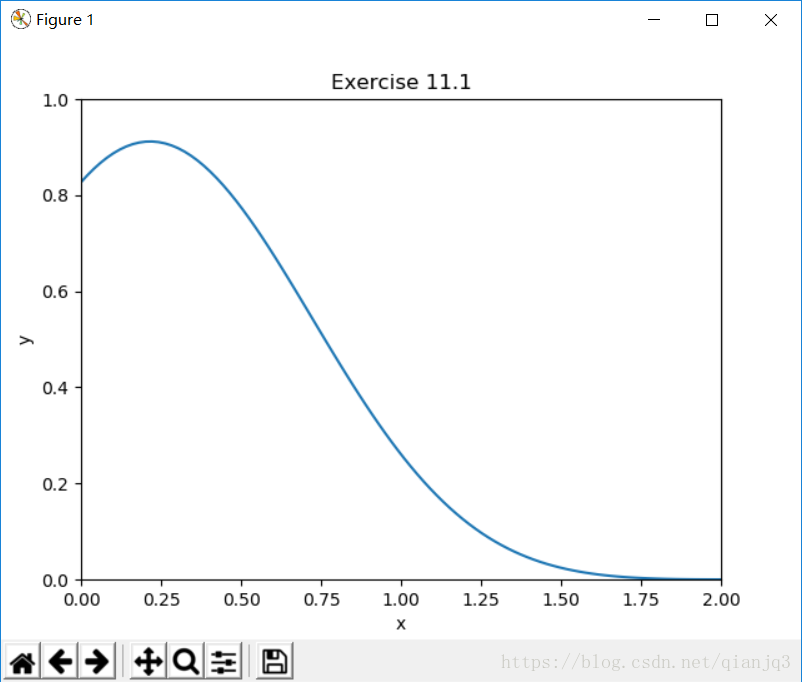
>>> True_Cofficient = axes.plot(a,b,'bo')
>>> Estimate_Cofficient = axes.plot(a._b,'r+')
Traceback (most recent call last):
File "<pyshell#41>", line 1, in <module>
Estimate_Cofficient = axes.plot(a._b,'r+')
AttributeError: 'numpy.ndarray' object has no attribute '_b'
>>> Estimate_Cofficient = axes.plot(a,_b,'r+')
>>> plt.legend([True_Cofficient,Estimate_Cofficient],['True cofficients','Estimated cofficients'])
>>> axes.set_xlabel('Index')
Text(0.5,0,'Index')
>>> axes.set_ylabel('Value')
Text(0,0.5,'Value')
>>> axes.set_xlim((0,10))
(0, 10)
>>> axes.set_ylim((-2,2))
(-2, 2)
>>> axes.set_title('Exercise 11.2')
Text(0.5,1,'Exercise 11.2')
>>> plt.show()
import numpy as np
import matplotlib.pyplot as plt
from scipy import stats
import matplotlib
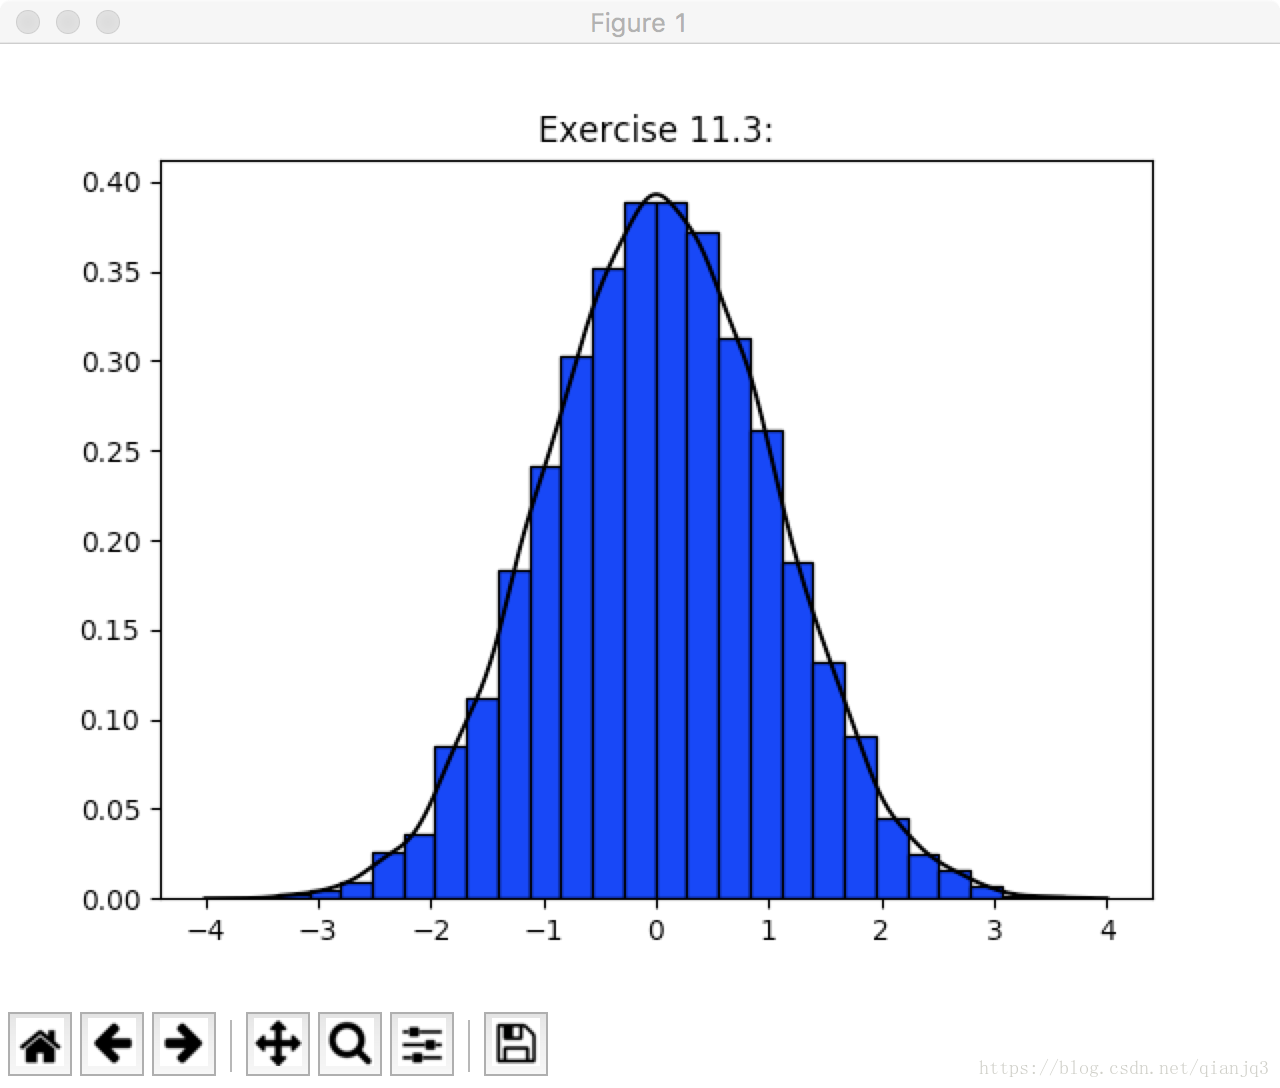
z=np.random.randn(10000)
figure,axes=plt.subplots()
c,d,e=axes.hist(z, bins=25,color='b',density=True)
axes.set_title('Exercise 11.3:')
plt.setp(e, edgecolor='k')
kernel=stats.gaussian_kde(z)
x=np.linspace(-4,4,1000)
y=kernel.pdf(x)
axes.plot(x,y,'k-')
plt.show()


 5639
5639

 被折叠的 条评论
为什么被折叠?
被折叠的 条评论
为什么被折叠?
 到【灌水乐园】发言


