


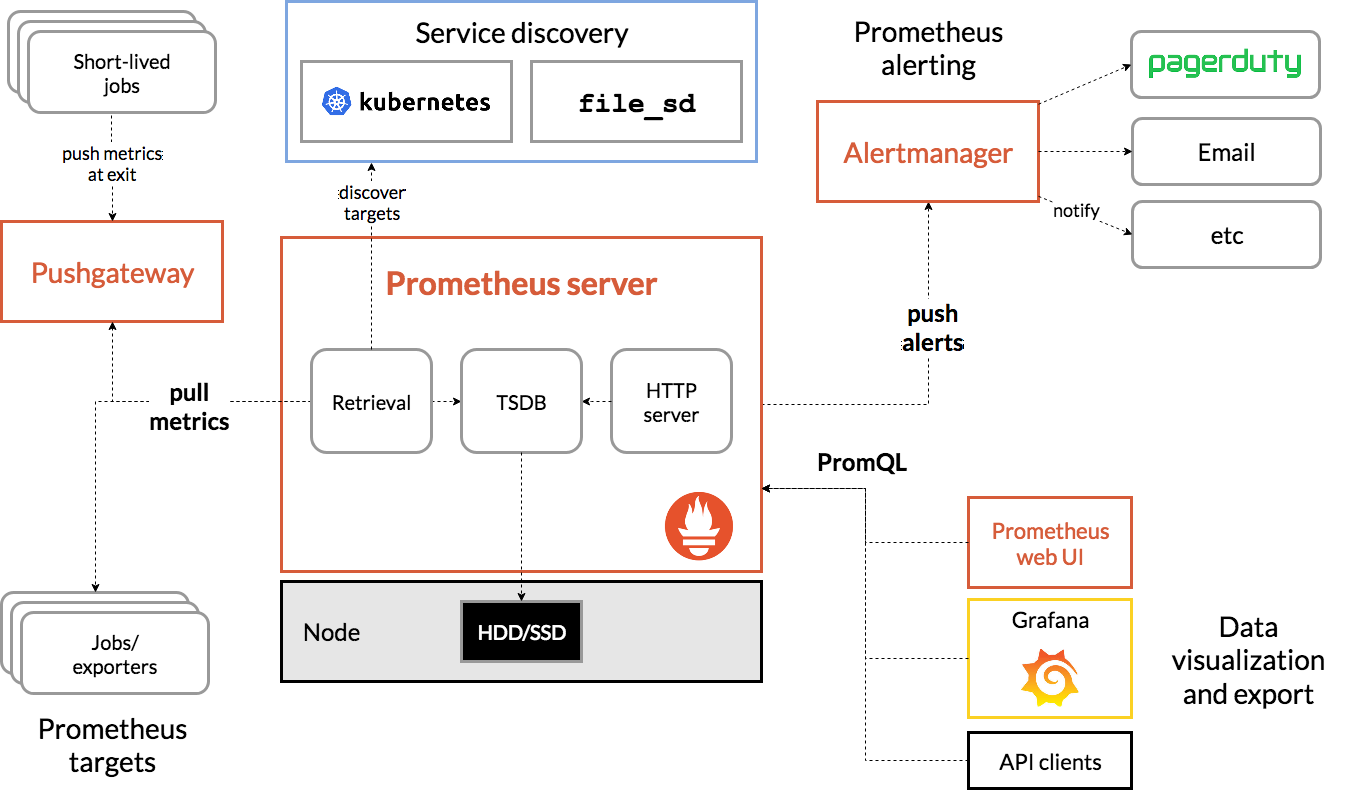
Prometheus是一套开源的监控&报警&时间序列数据库的组合,基于应用的metrics来进行监控的开源工具 。
业务集成Prometheus这个事情分为两步
- 第一步业务方Prometheus tragets收集好指标metrics后,以接口的形式暴露出来。
- 第二步Prometheus Server会对业务方暴露的接口发起HTTP调用pull metrics
最后Prometheus拿到业务方收集好的指标后,以图形化界面展示出来Prometheus web UI、Grafana。
作为业务方,需要清楚如何收集自己服务的指标并以接口的形式暴露。
参考
Prometheus+SpringBoot应用监控全过程详解
SpringBoot集成Prometheus
SpringBoot集成Actuator端点配置
SpringBoot集成prometheus
SpringBoot Actuator端点的实现原理【概括整理】
actuator的端点列表
| ID | JMX | HTTP | 描述 |
|---|---|---|---|
| auditevents | Yes | No | 公开当前应用程序的审核事件信息 |
| beans | Yes | No | 显示应用程序中所有Spring bean的完整列表 |
| caches | Yes | No | 公开可用的缓存 |
| conditions | Yes | No | 显示在配置和自动配置类上评估的条件,以及它们匹配或不匹配的原因 |
| configprops | Yes | No | 显示所有@ConfigurationProperties的整理列表 |
| env | Yes | No | 从Spring的ConfigurableEnvironment中公开属性 |
| flyway | Yes | No | 显示已应用的所有Flyway数据库迁移 |
| health | Yes | Yes | 显示应用程序运行状况信息 |
| heapdump | N/A | No | 返回hprof堆转储文件。 |
| httptrace | Yes | No | 显示HTTP跟踪信息(默认情况下,最后100个HTTP请求-响应交换) |
| info | Yes | Yes | 显示任意应用程序信息 |
| integrationgraph | Yes | No | 显示Spring集成图 |
| jolokia | N/A | No | 通过HTTP公开JMX bean(当Jolokia在类路径上时,WebFlux不可用) |
| logfile | N/A | No | 返回日志文件的内容(如果已设置logging.file或logging.path属性)。支持使用 HTTP Range 头来检索日志文件的部分内容 |
| loggers | Yes | No | 显示和修改应用程序中记录器的配置 |
| liquibase | Yes | No | 显示已应用的任何Liquibase数据库迁移 |
| metrics | Yes | No | 显示当前应用程序的"度量"信息 |
| mappings | Yes | No | 显示所有@RequestMapping路径的整理列表 |
| prometheus | N/A | No | 以Prometheus服务器可以抓取的格式公开度量 |
| scheduledtasks | Yes | No | 显示应用程序中的计划任务 |
| sessions | Yes | No | 允许从支持Spring Session的会话存储中检索和删除用户会话。在使用Spring Session对反应式web应用程序的支持时不可用 |
| shutdown | Yes | No | 允许优雅地关闭应用程序 |
| threaddump | Yes | No | 执行线程转储 |
操作
POM
<!--基于Springboot-->
<parent>
    <artifactId>spring-boot-starter-parent</artifactId>
    <groupId>org.springframework.boot</groupId>
    <version>2.3.1.RELEASE</version>
    <relativePath/>
</parent>
<properties>
        <maven.compiler.source>8</maven.compiler.source>
        <maven.compiler.target>8</maven.compiler.target>
        <java.version>1.8</java.version>
        <project.build.sourceEncoding>UTF-8</project.build.sourceEncoding>
        <project.reporting.outputEncoding>UTF-8</project.reporting.outputEncoding>
        <skipTests>true</skipTests>

        <spring-boot.version>2.3.1.RELEASE</spring-boot.version>
</properties>
<dependencies>
    <dependency>
        <groupId>org.springframework.boot</groupId>
        <artifactId>spring-boot-starter-web</artifactId>
        <exclusions>
            <exclusion>
                <groupId>org.springframework.boot</groupId>
                <artifactId>spring-boot-starter-tomcat</artifactId>
            </exclusion>
        </exclusions>
    </dependency>
    <dependency>
        <groupId>org.springframework.boot</groupId>
        <artifactId>spring-boot-starter</artifactId>
    </dependency>
    <!--    使用 容器 undertow    -->
    <dependency>
        <groupId>org.springframework.boot</groupId>
        <artifactId>spring-boot-starter-undertow</artifactId>
    </dependency>
    <!--    解决启动WARN  Buffer pool was not set on WebSocketDeploymentInfo, the default pool will be used   -->
    <dependency>
        <groupId>io.undertow</groupId>
        <artifactId>undertow-websockets-jsr</artifactId>
    </dependency>
    <!--    增加springboot的指标检测    -->
    <dependency>
        <groupId>org.springframework.boot</groupId>
        <artifactId>spring-boot-starter-actuator</artifactId>
    </dependency>
    <!--    增加springboot的prometheus监控指标检测    -->
    <dependency>
        <groupId>io.micrometer</groupId>
        <artifactId>micrometer-registry-prometheus</artifactId>
        <scope>runtime</scope>
    </dependency>
<!--    springBoot 低版本需要增加一下依赖来收集指标,micrometer-registry-prometheus版本要一致    -->
<!--     <dependency>   -->
<!--           <groupId>io.micrometer</groupId>   -->
<!--           <artifactId>micrometer-spring-legacy</artifactId>   -->
<!--            <version>1.0.5</version>   -->
<!--       </dependency>   -->

        <!-- 仪表盘12856 的描述内容。可选, 用于进程内存使用图表 -->
        <dependency>
            <groupId>io.github.mweirauch</groupId>
            <artifactId>micrometer-jvm-extras</artifactId>
            <version>0.2.0</version>
            <scope>runtime</scope>
        </dependency>
</dependencies>
application.yml
server:
  port: 9521
  servlet:
    context-path: /ecb
spring:
  jackson:
    date-format: yyyy-MM-dd HH:mm:ss
    time-zone: GMT+8
management:
  metrics:
    export:
      prometheus: # 开启 prometheus 检测端点
        enabled: true
    tags:
      application: ${spring.application.name}
  endpoints:
    web:
      exposure:
        include: '*'
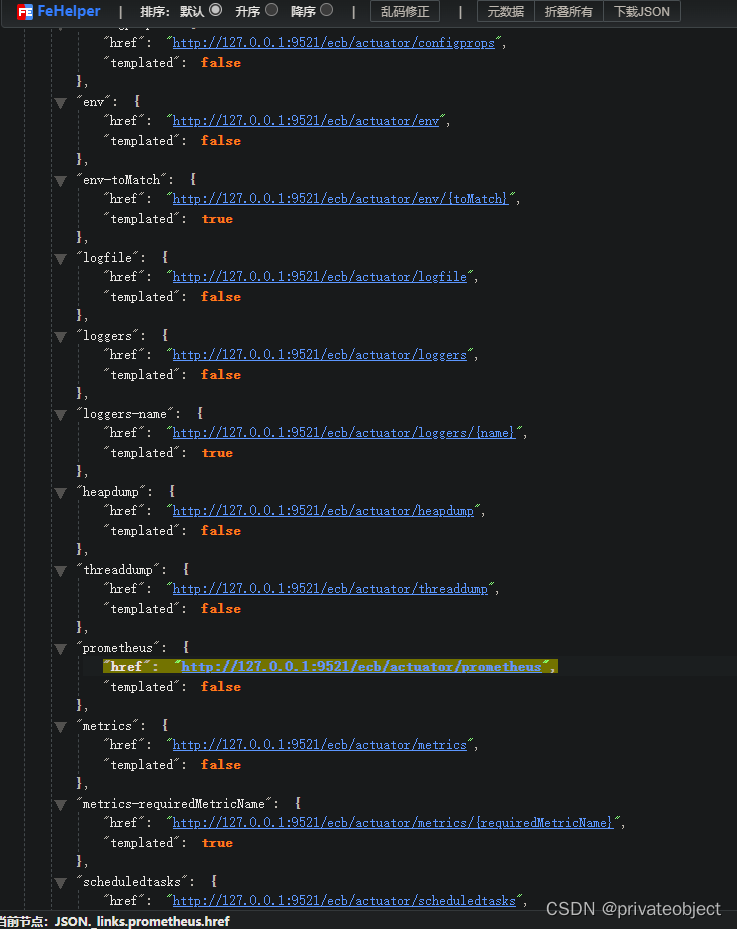
访问actuator验证
地址:127.0.0.1:9521/ecb/actuator
{
    "_links": {
        "self": {
            "href": "http://127.0.0.1:9521/ecb/actuator",
            "templated": false
        },
        "beans": {
            "href": "http://127.0.0.1:9521/ecb/actuator/beans",
            "templated": false
        },
        "caches-cache": {
            "href": "http://127.0.0.1:9521/ecb/actuator/caches/{cache}",
            "templated": true
        },
        "caches": {
            "href": "http://127.0.0.1:9521/ecb/actuator/caches",
            "templated": false
        },
        "health-path": {
            "href": "http://127.0.0.1:9521/ecb/actuator/health/{*path}",
            "templated": true
        },
        "health": {
            "href": "http://127.0.0.1:9521/ecb/actuator/health",
            "templated": false
        },
        "info": {
            "href": "http://127.0.0.1:9521/ecb/actuator/info",
            "templated": false
        },
        "conditions": {
            "href": "http://127.0.0.1:9521/ecb/actuator/conditions",
            "templated": false
        },
        "configprops": {
            "href": "http://127.0.0.1:9521/ecb/actuator/configprops",
            "templated": false
        },
        "env": {
            "href": "http://127.0.0.1:9521/ecb/actuator/env",
            "templated": false
        },
        "env-toMatch": {
            "href": "http://127.0.0.1:9521/ecb/actuator/env/{toMatch}",
            "templated": true
        },
        "logfile": {
            "href": "http://127.0.0.1:9521/ecb/actuator/logfile",
            "templated": false
        },
        "loggers": {
            "href": "http://127.0.0.1:9521/ecb/actuator/loggers",
            "templated": false
        },
        "loggers-name": {
            "href": "http://127.0.0.1:9521/ecb/actuator/loggers/{name}",
            "templated": true
        },
        "heapdump": {
            "href": "http://127.0.0.1:9521/ecb/actuator/heapdump",
            "templated": false
        },
        "threaddump": {
            "href": "http://127.0.0.1:9521/ecb/actuator/threaddump",
            "templated": false
        },
        "prometheus": {
            "href": "http://127.0.0.1:9521/ecb/actuator/prometheus",
            "templated": false
        },
        "metrics": {
            "href": "http://127.0.0.1:9521/ecb/actuator/metrics",
            "templated": false
        },
        "metrics-requiredMetricName": {
            "href": "http://127.0.0.1:9521/ecb/actuator/metrics/{requiredMetricName}",
            "templated": true
        },
        "scheduledtasks": {
            "href": "http://127.0.0.1:9521/ecb/actuator/scheduledtasks",
            "templated": false
        },
        "mappings": {
            "href": "http://127.0.0.1:9521/ecb/actuator/mappings",
            "templated": false
        }
    }
}
调整配置
management.endpoints.web.exposure.include=health,info,prometheus
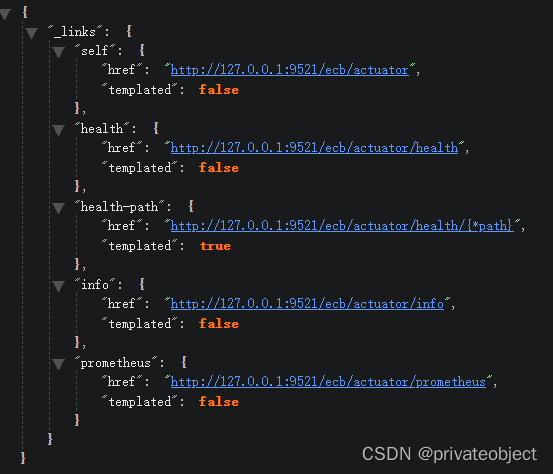
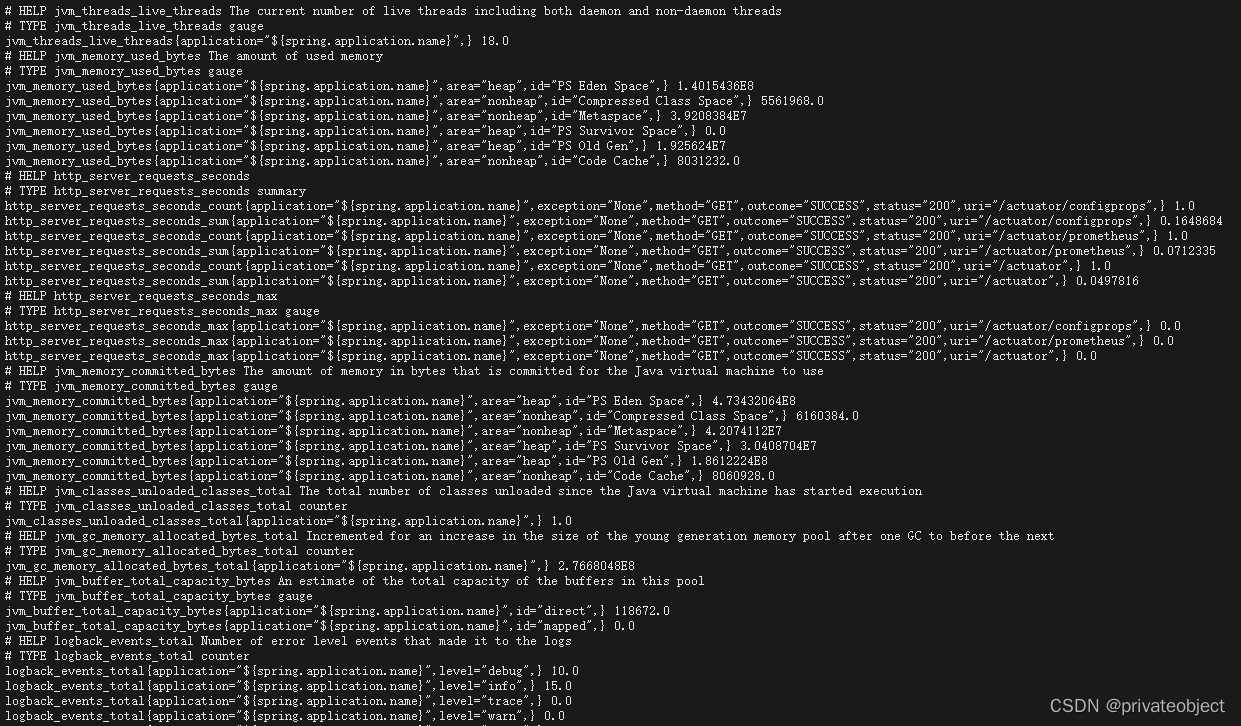
验证actuator/prometheus
prometheus增加检测配置
追加配置
vim /usr/local/prometheus/prometheus.yml
###
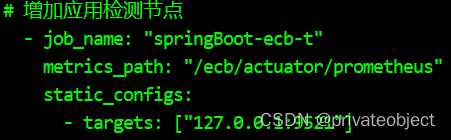
# 增加应用检测节点
- job_name: "springBoot-ecb-t"
metrics_path: "/ecb/actuator/prometheus"
static_configs:
- targets: ["127.0.0.1:9521"]
###
# 检查配置文件
/usr/local/prometheus/promtool check config /usr/local/prometheus/prometheus.yml
# 重启
systemctl restart prometheus
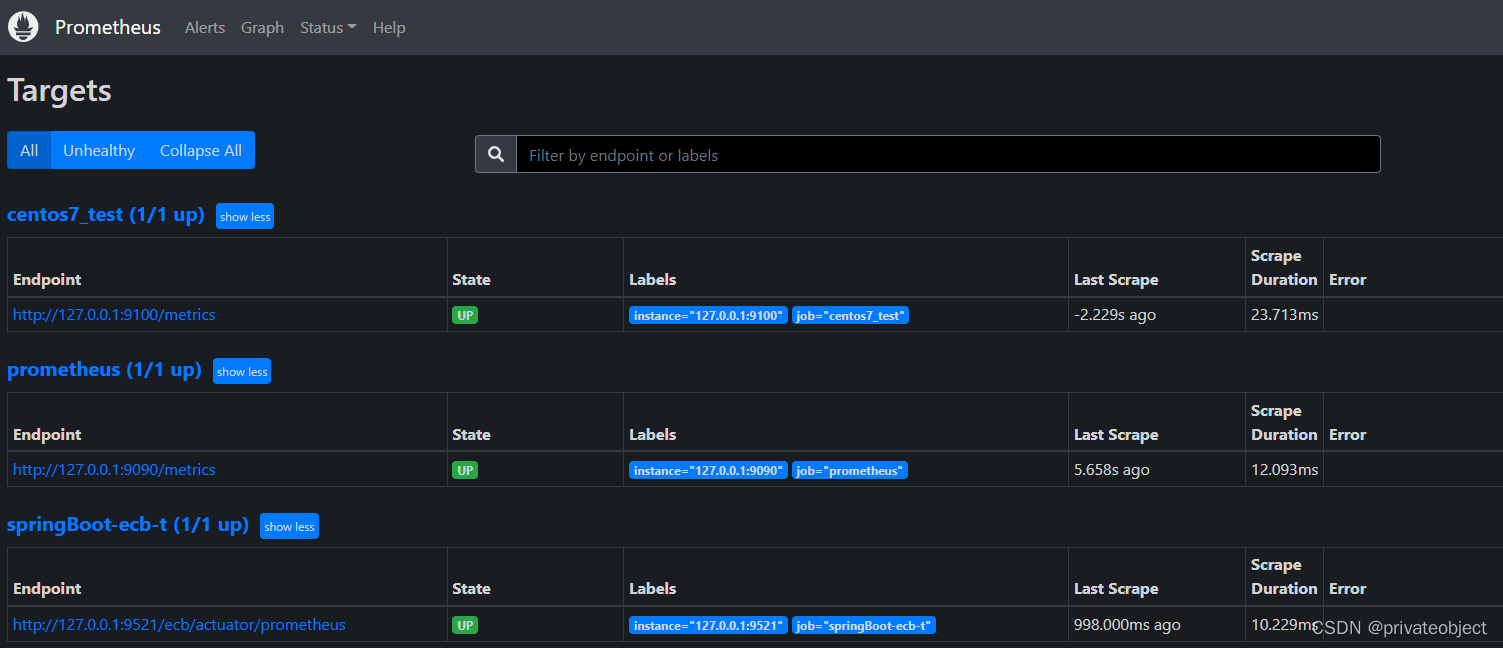
访问9090/targets验证
192.168.xxx.xxx:9090/targets
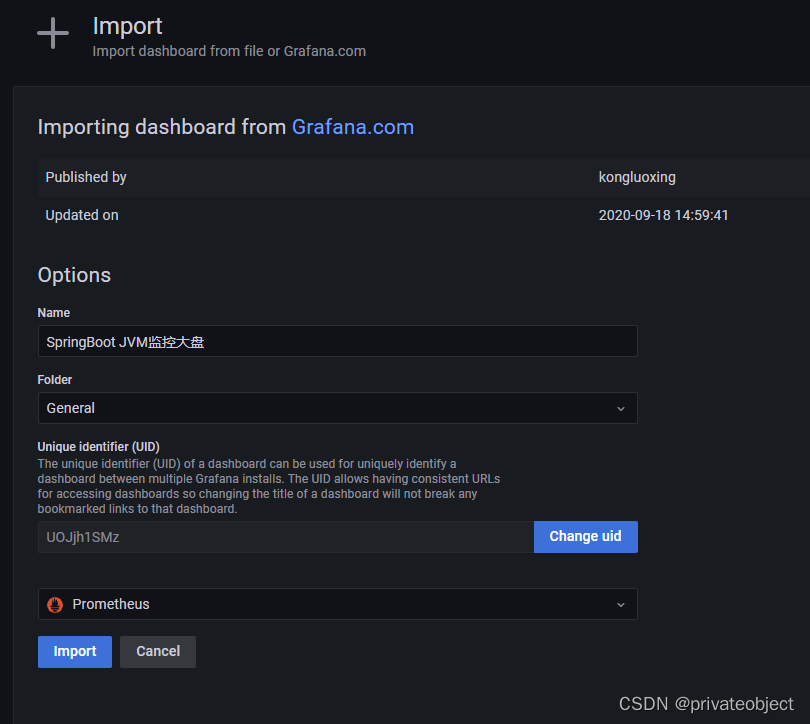
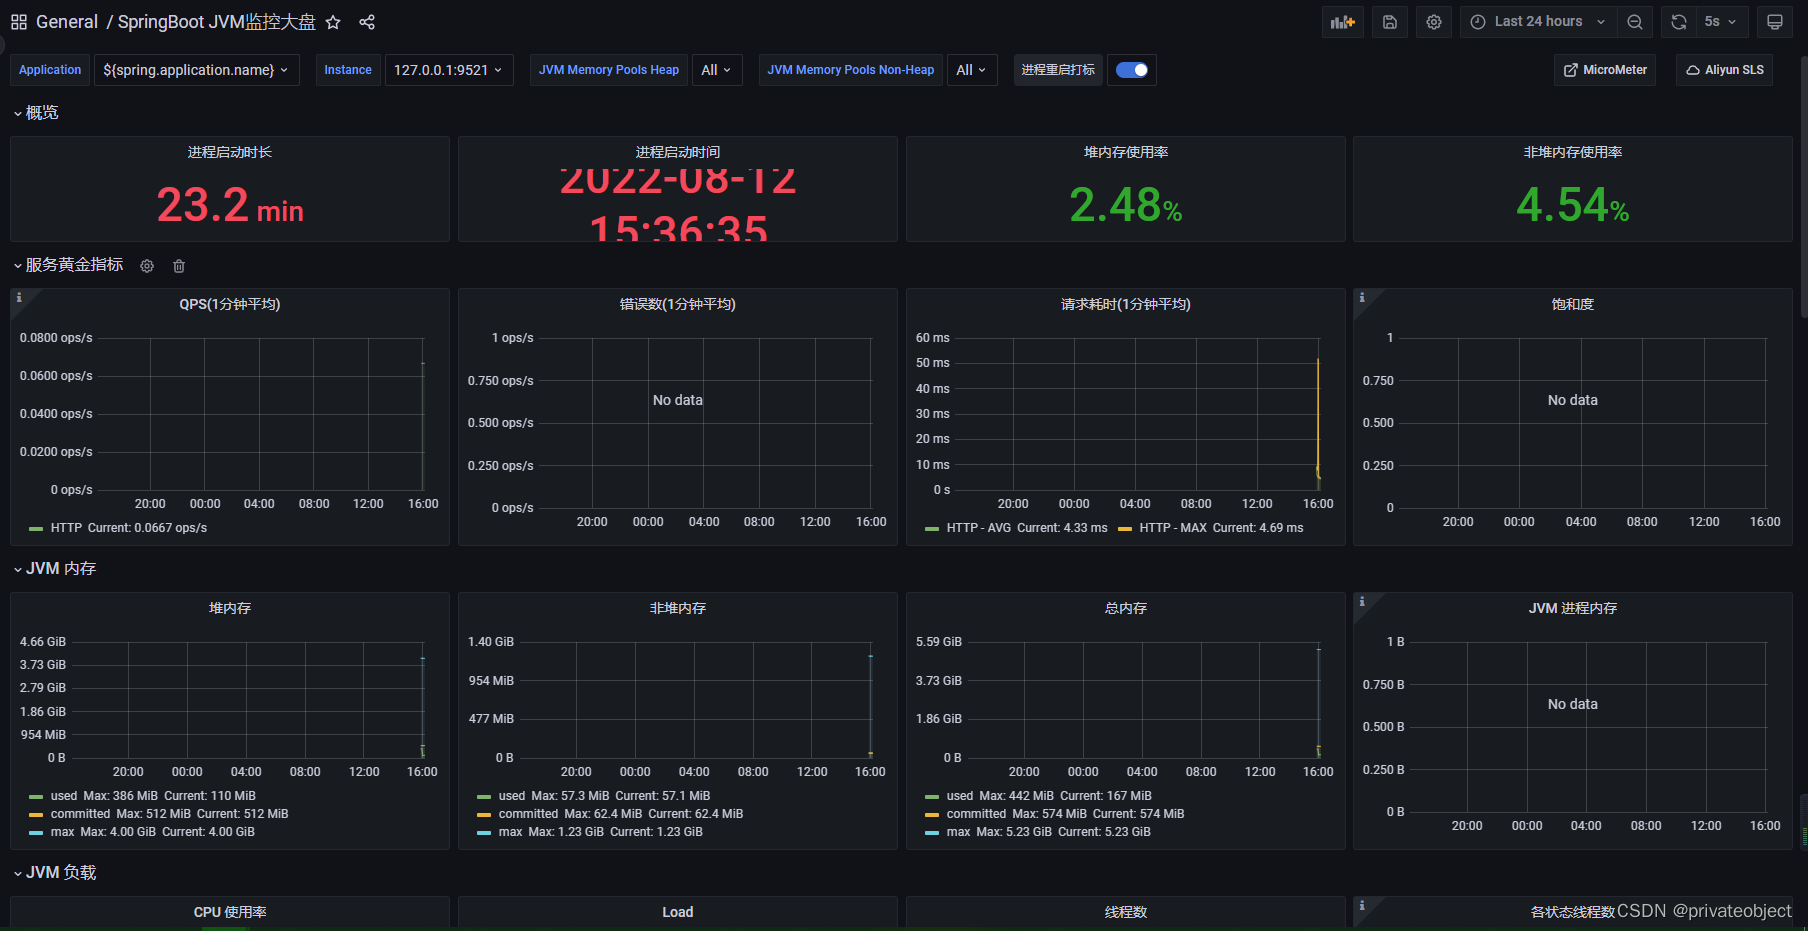
登录grafana配置面板
访问仪表盘,查询需要的面板
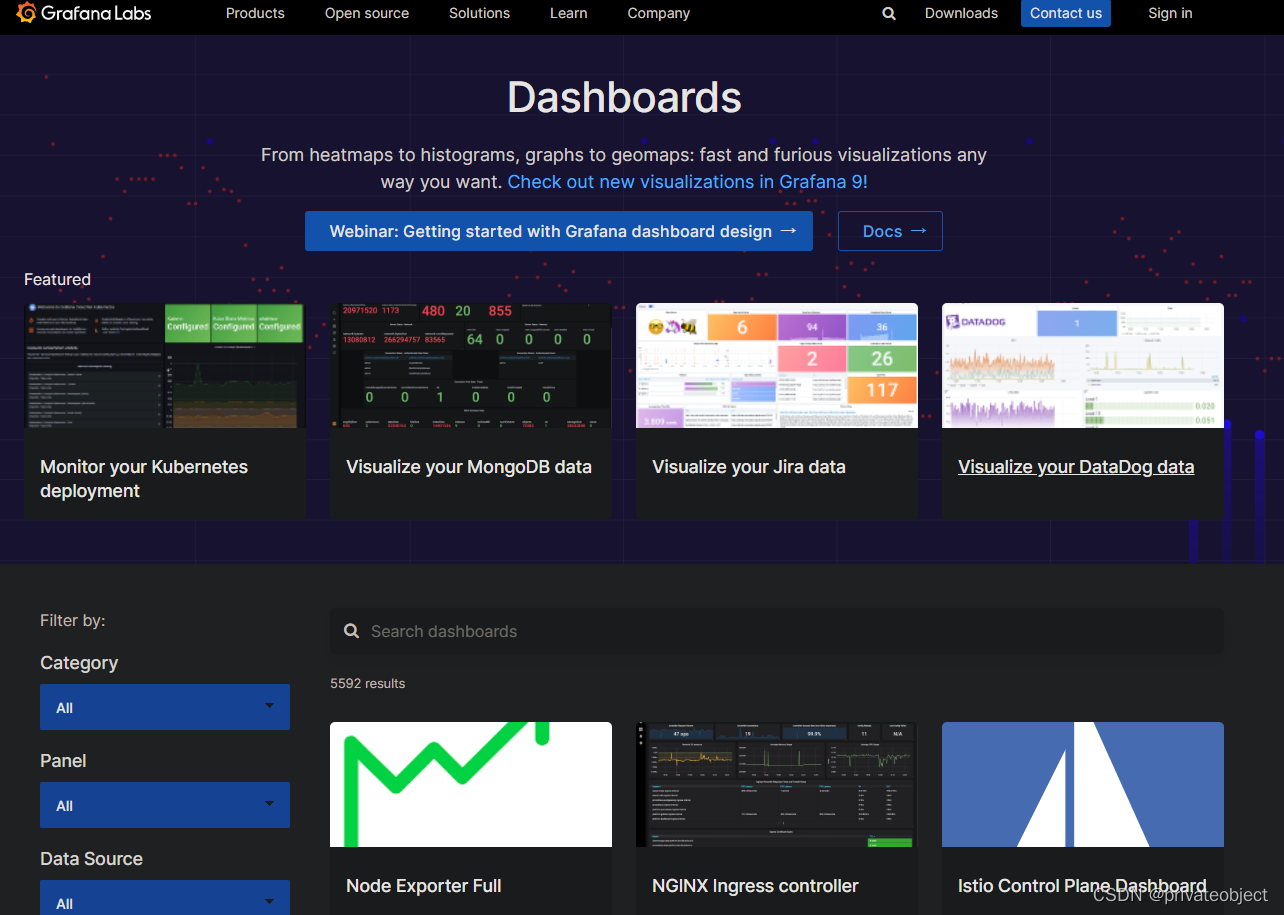
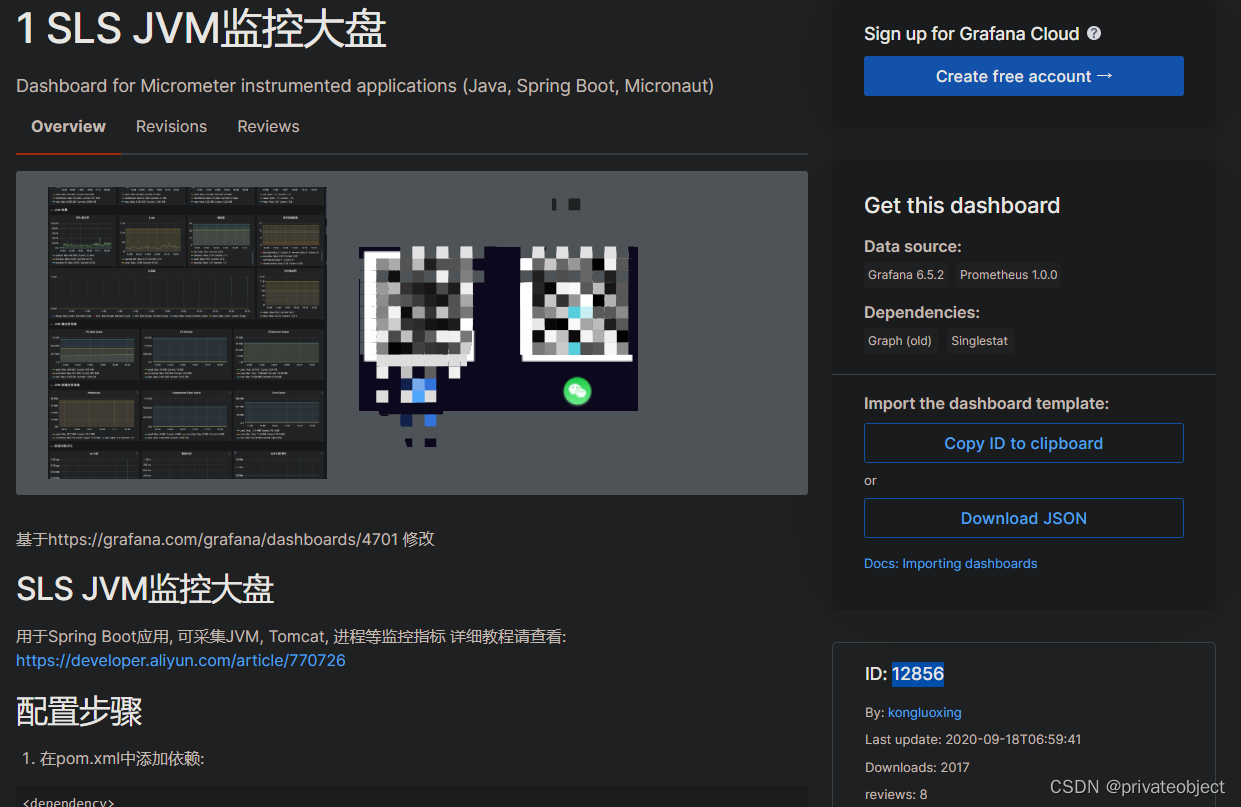
使用的仪表盘ID:12856,可以自己设计和在网上找


 1万+
1万+

 被折叠的 条评论
为什么被折叠?
被折叠的 条评论
为什么被折叠?
 到【灌水乐园】发言


