


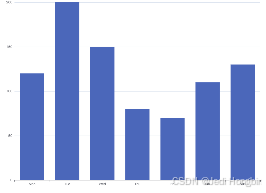
普通柱状图
自定义柱状图
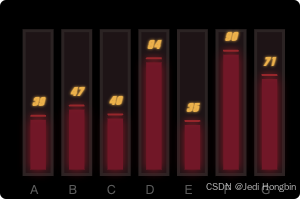
实现思路
4个图层
- 背景 边框实体 内部透明
- 地步透明间隙
- 红色柱形+数据数据使用自定义字体+倾斜
- 柱形上方扁平矩形矩形颜色透明 label字体颜色和背景色相同实现矩形块 上下靠padding实现 向下 paddingBottom使用负数
完整代码
<!DOCTYPE html>
<html style="height: 100%; background: #000">
    <head>
        <meta charset="utf-8" />
        <title>发光柱状图</title>
        <script src="https://cdn.jsdelivr.net/npm/echarts@5"></script>
        <style>
            /* 在 CSS 文件中定义自定义字体 */
            @font-face {
                font-family: "MyCustomFont"; /* 自定义字体名称 */
                src: url("public/只含数字.ttf");
                font-weight: normal;
                font-style: normal;
            }
        </style>
    </head>
    <body style="background: #fff; height: 100vh; overflow: hidden; padding: 200px">
        <div
            id="main"
            style="height: 200px; width: 300px"></div>
        <script>
            const chart = echarts.init(document.getElementById("main"));

            const data = [39, 47, 40, 84, 35, 90, 71];
            const categories = ["A", "B", "C", "D", "E", "F", "G"];
            const redBarOffset = 5;
            // 最大值为100时 如下 增加 下方空隙 + 上方label
            const maxBarValue = 100 + redBarOffset + 10;

            const fontSize = 12;

            const option = {
                backgroundColor: "#000",
                xAxis: {
                    type: "category",
                    data: categories,
                    axisLine: { lineStyle: { color: "transparent" } },
                    axisLabel: {
                        color: "#666",
                        fontSize: fontSize,
                    },
                },
                yAxis: {
                    show: false,
                    max: maxBarValue + redBarOffset + 10,
                },
                grid: {
                    left: "5%",
                    right: "5%",
                    bottom: "12%",
                    top: "5%",
                },
                series: [
                    // 金色背景柱
                    {
                        type: "bar",
                        data: Array(data.length).fill(maxBarValue),
                        barWidth: "80%",
                        itemStyle: {
                            color: "#211316fa",
                            borderColor: "#302727",
                            borderWidth: 3,
                        },
                        z: 1,
                    },
                    // 占位透明柱(用于悬空红柱)
                    {
                        type: "bar",
                        data: Array(data.length).fill(redBarOffset),
                        stack: "data",
                        barWidth: "40%",
                        itemStyle: {
                            color: "transparent",
                        },

                        z: 2,
                    },
                    // 红色柱子(真实数据)
                    {
                        type: "bar",
                        animationDuration: 1500,
                        animationEasing: "elasticOut",
                        data: data.map(v => v),
                        stack: "data",
                        barGap: "-75%",
                        itemStyle: {
                            color: "#7A192A",
                            // color: new echarts.graphic.LinearGradient(0, 0, 0, 1, [
                            //     { offset: 0, color: "#9D1727" },
                            //     { offset: 1, color: "#8A2F34" },
                            // ]),
                            shadowColor: "#9D1727",
                            shadowBlur: 10,
                        },
                        label: {
                            show: true,
                            position: "top",
                            color: "#eebb43",
                            fontWeight: "bold",
                            fontSize: fontSize,
                            formatter: "{c}",
                            fontFamily: "MyCustomFont",
                            fontStyle: "italic",
                            textShadowColor: "#eebb43",
                            textShadowBlur: 3,
                            distance: fontSize,
                        },
                        z: 3,
                    },

                    // 顶部矩形块 用label替代
                    {
                        type: "bar",
                        stack: "data",
                        data: data.map(v => 0),
                        color: "transparent",
                        label: {
                            show: true, // 显示标签
                            position: "top", // 标签位置(如 top/inside/outside)
                            color: "#9f2C2D", // 文字颜色(白色更醒目)
                            backgroundColor: "#9f2C2D", // 背景颜色
                            borderRadius: fontSize / 7, // 边框圆角设为 0 实现矩形
                            // padding: [fontSize / 6, fontSize / 1.5], // 内边距调整矩形大小
                            padding: [0, fontSize / 1.5, -fontSize / 6, fontSize / 1.5], // 内边距调整矩形大小
                            formatter: "", // 显示数据值({c} 代表数据值)
                            shadowColor: "#9f2C2D",
                            shadowBlur: fontSize / 2,
                            align: "center",
                        },
                        z: 4,
                    },
                ],
            };

            chart.setOption(option);
        </script>
    </body>
</html>


 被折叠的 条评论
为什么被折叠?
被折叠的 条评论
为什么被折叠?
 到【灌水乐园】发言


