


摘要: Apache DolphinScheduler系列4-后台SQL经验分享
关键词: 大数据、数据质量、数据调度
整体说明
在调研了 DolphinScheduler 之后,在项目上实际使用了一段时间,有了一些后台SQL实际经验,分享如下。
- 进入DolphinScheduler 后台数据库,我这里使用的是MySQL数据库。
- 以任务名称包含“ods_xf_act” 的任务为例。
一、修改任务组操作
UPDATE t_ds_task_definition a
join t_ds_task_definition_log b on a.`code`=b.`code` and a.version=b.version
set a.task_group_id = 19,b.task_group_id=19
where a.name like '%ods_xf_act%'
二、批量修改任务执行类型
UPDATE t_ds_process_definition a
join t_ds_process_definition_log b on a.code=b.code and a.version=b.version
set a.execution_type = 1,b.execution_type=1
where a.name like '%ods_xf_act%';
三、查看定时器配置情况
根据此来选择配置定时器
select crontab,count(*) from t_ds_schedules
group by crontab
order by count(*) desc
四、批量更改定时器
定时器,在前台页面修改很麻烦,一个个改很慢,所以想着从后台批量修改。
- 确定需要更新的定时器列表
select t1.id,t1.process_definition_code,crontab,t2.name from t_ds_schedules t1
join t_ds_process_definition t2
on t1.process_definition_code = t2.`code`
where name like '%ods_xf_act%'
and crontab like '%0 0 5 *%'
- 更新成需要的crontab定时器
update t_ds_schedules t1
join t_ds_process_definition t2
on t1.process_definition_code = t2.`code`
set t1.crontab = '0 0 11 * * ? *'
where name like '%ods_xf_act%'
and crontab like '%0 0 5 *%'
- 更新成需要的crontab定时器触发表
由于定时器已经 5 -> 11修改完成, 所以后面的where 条件都是 11
update qrtz_cron_triggers t1
set t1.CRON_EXPRESSION = '0 0 11 * * ? *'
where t1.TRIGGER_NAME in (
select concat("job_",t1.id) from t_ds_schedules t1
join t_ds_process_definition t2
on t1.process_definition_code = t2.`code`
where name like '%ods_xf_act%'
and crontab like '%0 0 11 *%'
)
- 更新成最新crontab定时触发时间的起始时间
由于NEXT_FIRE_TIME有更新时差,所以往前推8小时
update qrtz_triggers t1
set t1.NEXT_FIRE_TIME = round(UNIX_TIMESTAMP(date_sub("2024-07-23 11:00:00", INTERVAL 8 HOUR) )*1000)
where t1.TRIGGER_NAME in (
select concat("job_",t1.id) from t_ds_schedules t1
join t_ds_process_definition t2
on t1.process_definition_code = t2.`code`
where name like '%ods_xf_act%'
and crontab like '%0 0 11 *%'
)
五、通知策略修改为“都不发”,仍然告警
现象: 原先选择“失败发”,后面修改为“都不发”
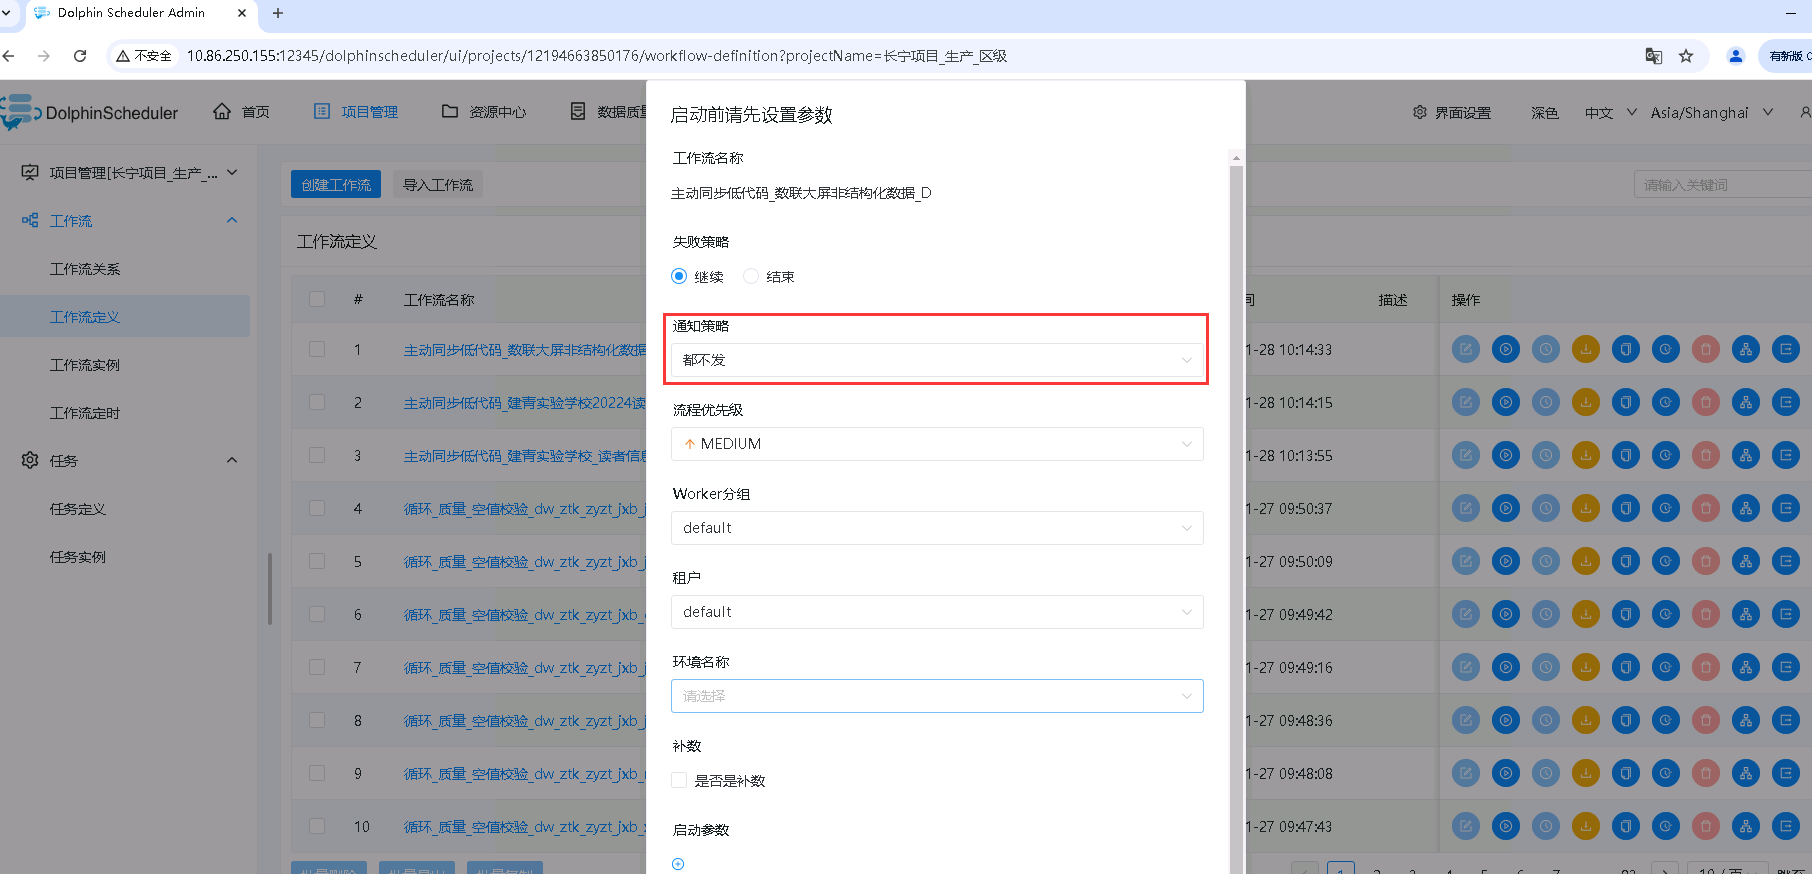
原因: 原先有告警组,然后修改为都不发,原告警组后台并没有修改,是一个bug。
临时解决方案:
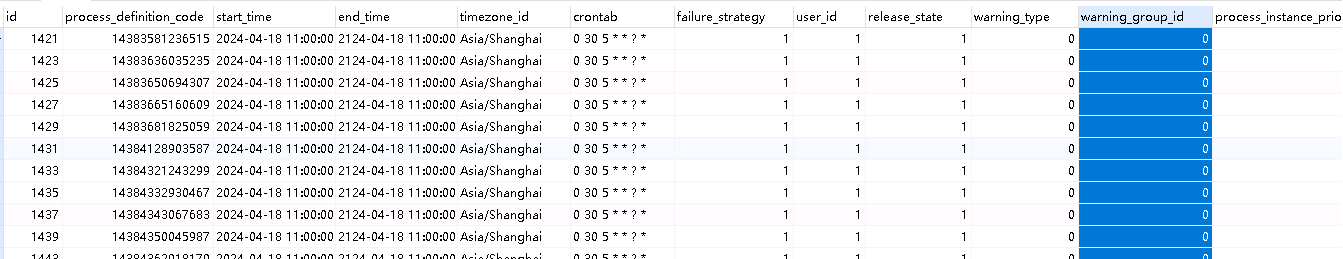
select t1.*
from t_ds_schedules t1
join t_ds_process_definition t2
on t1.process_definition_code = t2.`code`
where name like '%ods_xf_act%'
把warning_type = 0 的,对应warning_group_id 都修改为 0
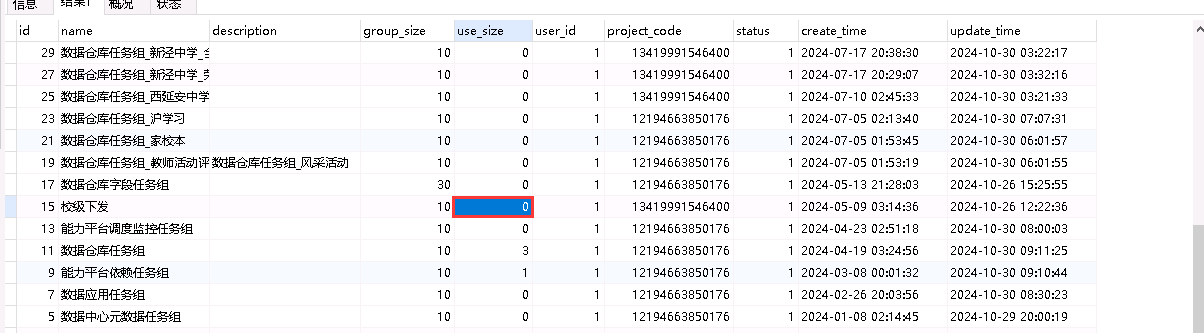
六、任务组队列,页面没有任务,已用资源却占满
查看任务组列表
select * from t_ds_task_group
order by create_time desc
– 如果遇到任务组是满的,页面查询却没有任务,可以手动修改字段值
查看任务组队列列表,找出没有完成,修改成已完成,就是修改值为2。
-- t_ds_task_group_queue.`status` tinyint(4) DEFAULT '-1' COMMENT '-1: waiting  1: running  2: finished'

select * from t_ds_task_group_queue
where 1=1
and status <> 2  -- finished 完成
order by create_time desc
查看任务列表,找出没有完成,修改成已完成,就是修改值为7。
-- t_ds_task_instance.`state` tinyint(4) DEFAULT NULL COMMENT 'Status: 0 commit succeeded, 1 running, 2 prepare to pause, 3 pause, 4 prepare to stop, 5 stop, 6 fail, 7 succeed, 8 need fault tolerance, 9 kill, 10 wait for thread, 11 wait for dependency to complete'

-- id 是上面t_ds_task_group_queue的task_id

select * from t_ds_task_instance
where state <> 7 -- success
and id in (
select id from t_ds_task_group_queue
where 1=1
and status <> 2  -- finished 完成
order by create_time desc
)
order by submit_time desc
limit 100


 被折叠的 条评论
为什么被折叠?
被折叠的 条评论
为什么被折叠?
 到【灌水乐园】发言


