


 本文介绍如何使用 Pandas 的 Styler 对 DataFrame 进行样式设置,包括应用样式函数、切片选择、值的格式化等技巧,并展示了如何创建热力图背景、设置单元格属性及导出样式。
1. 创建样式
传递样式函数的方法:
-
Styler.applymap: 逐个元素,返回带有CSS属性-值对的单个字符串。 -
Styler.apply: 列/行/表方式,返回形状相同的Series或DataFrame,其中每个值都是带有CSS属性值对的字符串。
Styler.applymap 作用于DataFrame中的每一个元素。Styler.apply 通过axis参数,每一次将一列或一行或整个表传递到DataFrame中。对于按列使用 axis=0, 按行使用 axis=1, 整个表使用 axis=None.
-
import pandas as pd -
import numpy as np -
np.random.seed(24) -
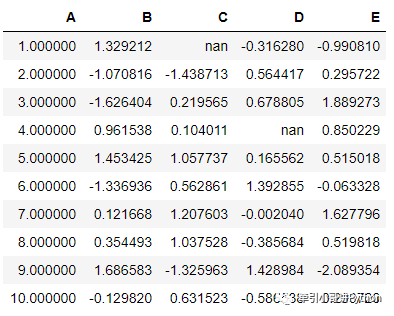
df = pd.DataFrame({'A': np.linspace(1, 10, 10)}) -
df = pd.concat([df, pd.DataFrame(np.random.randn(10, 4), columns=list('BCDE'))], -
axis=1) -
df.iloc[3, 3] = np.nan -
df.iloc[0, 2] = np.nan
-
# 默认无样式 -
df.style

「注意」: DataFrame.style 返回Styler对象的属性。
-
# 通过调用.render方法来查看它们 -
df.style.highlight_null().render().split('\n')[:10]
-
['<style type="text/css" >', -
' #T_98ef3b58_b54d_11ea_87c2_8056f2b2fdccrow0_col2 {', -
' background-color: red;', -
' } #T_98ef3b58_b54d_11ea_87c2_8056f2b2fdccrow3_col3 {', -
' background-color: red;', -
' }</style><table id="T_98ef3b58_b54d_11ea_87c2_8056f2b2fdcc" ><thead> <tr> <th class="blank level0" ></th> <th class="col_heading level0 col0" >A</th> <th class="col_heading level0 col1" >B</th> <th class="col_heading level0 col2" >C</th> <th class="col_heading level0 col3" >D</th> <th class="col_heading level0 col4" >E</th> </tr></thead><tbody>', -
' <tr>', -
' <th id="T_98ef3b58_b54d_11ea_87c2_8056f2b2fdcclevel0_row0" class="row_heading level0 row0" >0</th>', -
' <td id="T_98ef3b58_b54d_11ea_87c2_8056f2b2fdccrow0_col0" class="data row0 col0" >1.000000</td>', -
' <td id="T_98ef3b58_b54d_11ea_87c2_8056f2b2fdccrow0_col1" class="data row0 col1" >1.329212</td>']
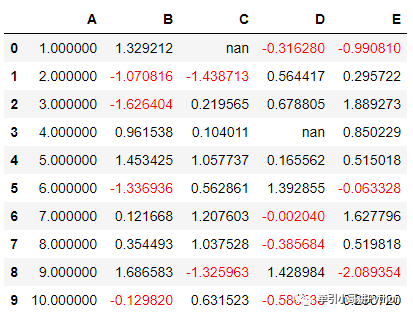
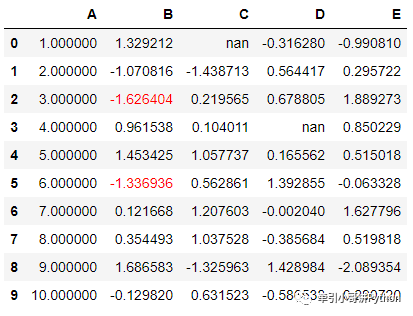
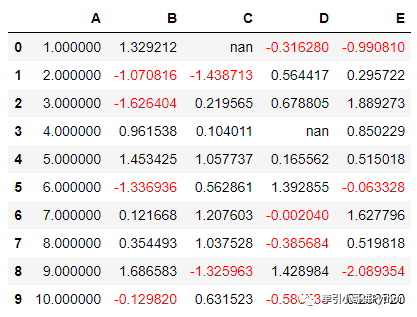
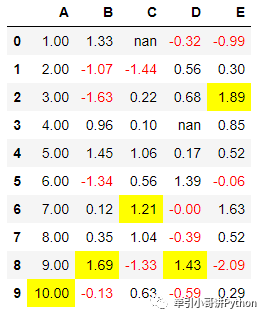
编写一个简单的样式函数,该函数会将负数涂成红色,将正数涂成黑色。
-
def color_negative_red(val): -
""" -
Takes a scalar and returns a string with -
the css property `'color: red'` for negative -
strings, black otherwise. -
""" -
color = 'red' if val < 0 else 'black' -
return 'color: %s' % color
在这种情况下,单元格的样式仅取决于其自身的值。我们应该使用在 Styler.applymap作用于每个元素。
df.style.applymap(color_negative_red)
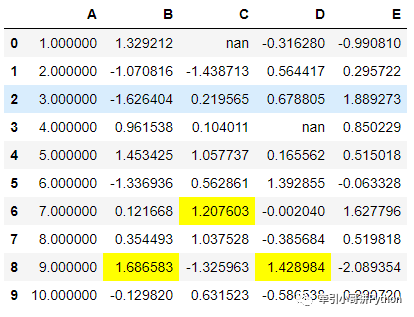
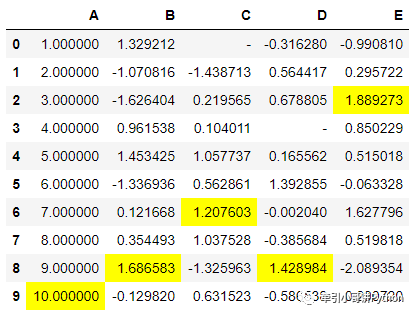
定义一个突出显示每列中的最大值的函数。
-
def highlight_max(s): -
''' -
highlight the maximum in a Series yellow. -
''' -
is_max = s == s.max() -
return ['background-color: yellow' if v else '' for v in is_max]
df.style.apply(highlight_max)
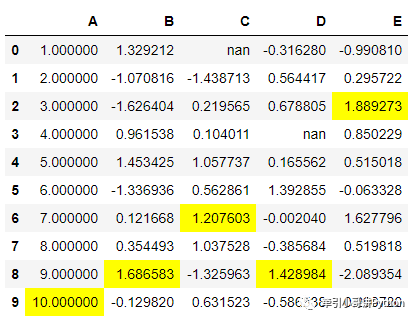
实际上,已有定义好的各类高亮函数:
配合axis参数使用
-
highlight_max():高亮最大值
-
highlight_min():高亮最小值
-
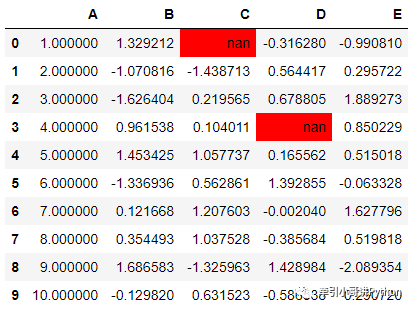
highlight_null():高亮空值
-
# 高亮行最大值 -
df.style.highlight_max(axis=1)
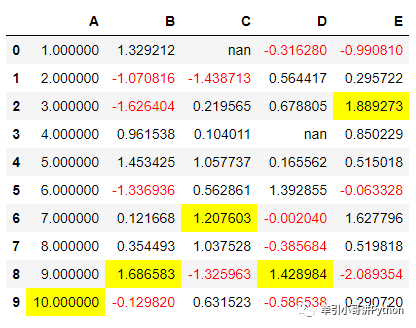
使用链式操作进行定义样式
df.style.applymap(color_negative_red).apply(highlight_max)
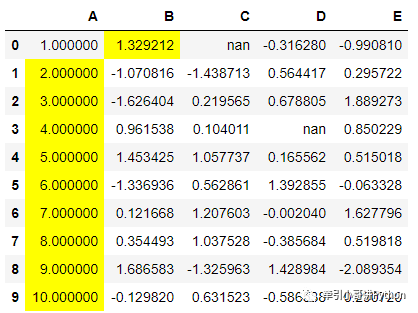
2. 切片
subset 参数控制作用的行列。
subset 传入的参数类似DataFrame的切片:
-
列标签
-
列表(或者numpy数组)
-
元组
(row_indexer, column_indexer)
df.style.apply(highlight_max, subset=['B', 'C', 'D'])
使用pd.IndexSlice构造一个切片元组。
-
# B, D两列,2:5行中的负数标红 -
df.style.applymap(color_negative_red, -
subset=pd.IndexSlice[2:5, ['B', 'D']])
「注意」:目前仅支持基于标签的切片,不支持位置切片。
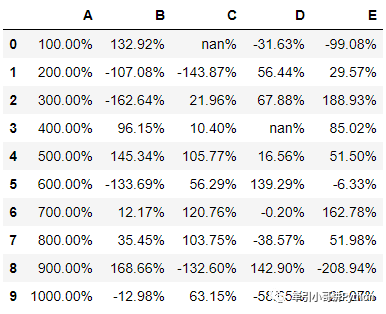
3.值的显示格式
使用Styler.format控制。类似字符串输出方法。
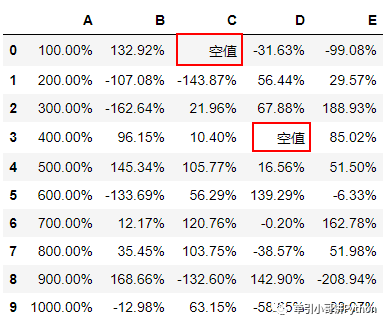
df.style.format("{:.2%}")
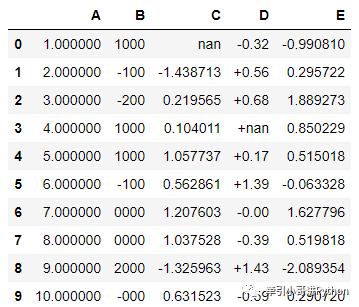
使用字典来格式化特定的列。
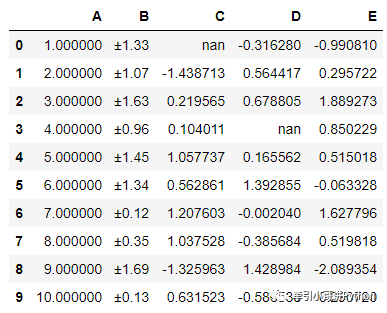
df.style.format({'B': "{:0<4.0f}", 'D': '{:+.2f}'})
使用lambda函数。
df.style.format({"B": lambda x: "±{:.2f}".format(abs(x))})
使用 na_rep设置空值的显示。
df.style.format("{:.2%}", na_rep="空值")
df.style.highlight_max().format(None, na_rep="-")
4. 内置样式函数
参考链接:https://pandas.pydata.org/docs/reference/style.html
-
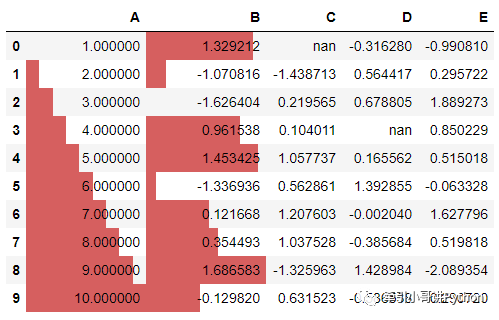
# 高亮空值 -
df.style.highlight_null(null_color='red')
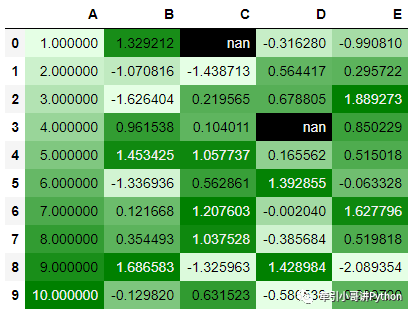
使用background_gradient 创建“热力图”式背景。需要配合matplotlib或者Seaborn使用。
-
import seaborn as sns -
cm = sns.light_palette("green", as_cmap=True) -
df.style.background_gradient(cmap=cm)
-
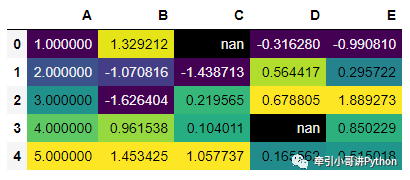
# Uses the full color range -
df.loc[:4].style.background_gradient(cmap='viridis')
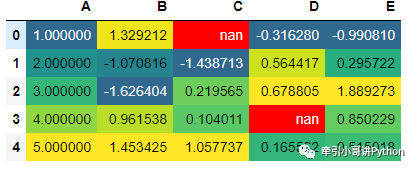
使用关键字参数low和high限定色谱百分比范围。
-
# Compress the color range -
(df.loc[:4] -
.style -
.background_gradient(cmap='viridis', low=.5, high=0) -
.highlight_null('red'))
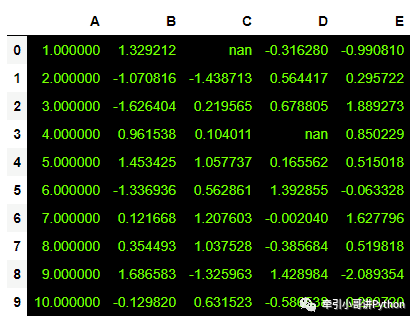
当样式不取决于值时,使用set_properties 。
-
df.style.set_properties(**{'background-color': 'black', -
'color': 'lawngreen', -
'border-color': 'white'})
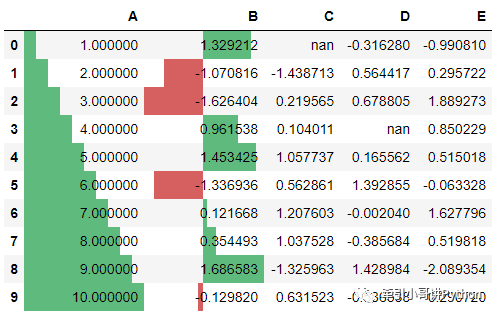
5. 数据中包含“条形图”
df.style.bar(subset=['A', 'B'], color='#d65f5f')
使用align 控制对其方式:
-
left: 最小值从单元格的左侧开始。 -
zero: 零值位于单元格的中心。 -
mid: t单元格的中心在(max-min)/ 2,或者如果值全为负(正),则零对齐于单元格的右(左)。
df.style.bar(subset=['A', 'B'], align='mid', color=['#d65f5f', '#5fba7d'])
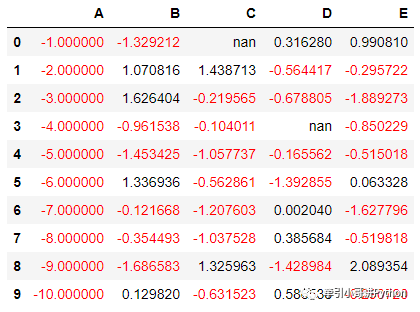
6. 共享样式
假设为DataFrame建立了一个样式,想将相同样式应用于第二个DataFrame。使用df1.style.export导出样式。
-
df2 = -df -
style1 = df.style.applymap(color_negative_red) -
style1
-
style2 = df2.style -
style2.use(style1.export()) -
style2
7. 其他样式
精度set_precision
df.style.applymap(color_negative_red).apply(highlight_max).set_precision(2)
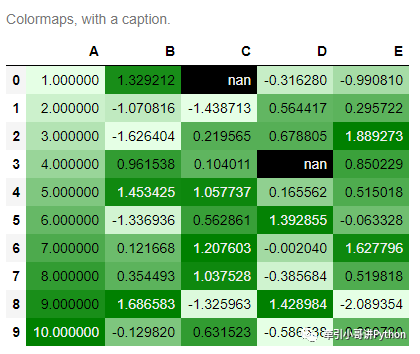
标题set_caption
-
df.style.set_caption('Colormaps, with a caption.')\ -
.background_gradient(cmap=cm)
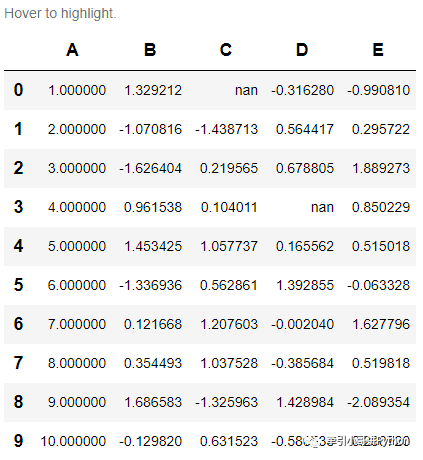
表格整体样式set_table_styles
-
from IPython.display import HTML -
def hover(hover_color="#ffff99"): -
return dict(selector="tr:hover", -
props=[("background-color", "%s" % hover_color)]) -
styles = [ -
hover(), -
dict(selector="th", props=[("font-size", "150%"), -
("text-align", "center")]), -
dict(selector="caption", props=[("caption-side", "top")]) -
] -
html = (df.style.set_table_styles(styles) -
.set_caption("Hover to highlight.")) -
html
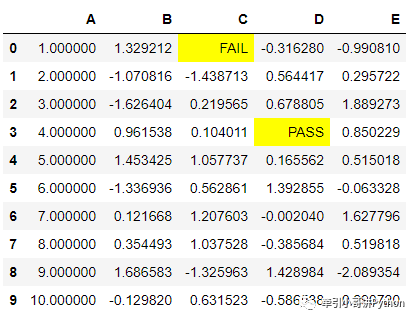
缺失值set_na_rep
-
(df.style -
.set_na_rep("FAIL") -
.format(None, na_rep="PASS", subset=["D"]) -
.highlight_null("yellow"))
隐藏索引hide_index或列hide_columns
-
# 隐藏索引 -
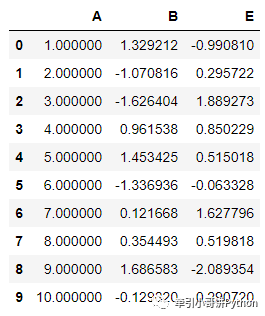
df.style.hide_index()
-
#隐藏列 -
df.style.hide_columns(['C','D'])
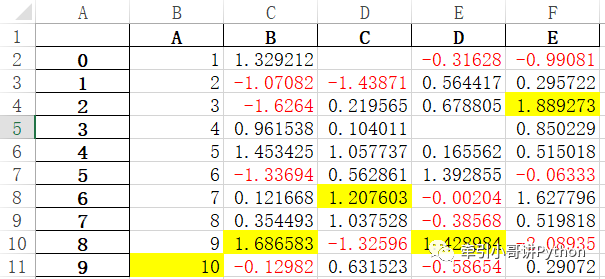
8. 导出为Excel(还在开发实验阶段)
DataFrames 使用「OpenPyXL」或「XlsxWriter」引擎可以将样式导出到Excel工作表。CSS2.2处理的属性包括:
-
background-color -
border-style,border-width,border-colorand their {top,right,bottom,leftvariants} -
color -
font-family -
font-style -
font-weight -
text-align -
text-decoration -
vertical-align -
white-space: nowrap -
当前仅支持CSS2命名或十六进制颜色,格式为
#rgb或#rrggbb。
-
df.style.\ -
applymap(color_negative_red).\ -
apply(highlight_max).\ -
to_excel('styled.xlsx', engine='openpyxl')


 17万+
17万+

 被折叠的 条评论
为什么被折叠?
被折叠的 条评论
为什么被折叠?
 到【灌水乐园】发言


