


 文章介绍了如何在Matplotlib中更改默认画板颜色,设置字体,以及提供多种背景和配色选项,以创建股票图表实例。
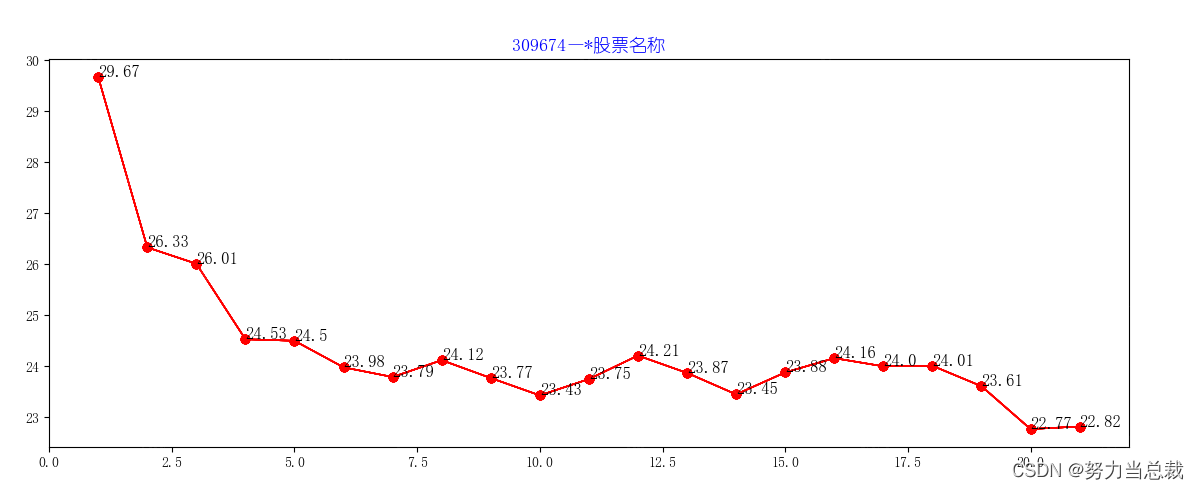
一 Matplotlib默认画板颜色为白色
import matplotlib.pyplot as plt
import matplotlib as mpl

font_name = "YouYuan"
mpl.rcParams['font.family']=font_name  # 设置字体
mpl.rcParams['axes.unicode_minus']=False  # 解决“-”的乱码问题

daima_name = {'301487': 'N盟固利', '309674': '*股票名称', '002310': '东方园林'}
daima = '309674'
name_1 = daima_name[daima]
name = daima + "—"+ name_1

y_list = [29.67, 26.33, 26.01, 24.53, 24.5, 23.98, 23.79, 24.12, 23.77, 23.43, 23.75, 24.21, 23.87, 23.45, 23.88, 24.16, 24.0, 24.01, 23.61, 22.77, 22.82]
x_list = [x  for x  in range(1,len(y_list)+1)]

for x, y, z in zip(x_list, y_list,y_list):
    plt.text(x, y,z, ha='left', va='bottom',fontsize=12,fontweight = "bold",verticalalignment = "baseline")
    plt.plot(x_list, y_list, 'ro--', alpha=0.5,linewidth = '1', linestyle = 'solid')
    plt.title(name, fontsize=13,color="blue",fontweight = "bold") # 本行显示默认字体

plt.show()
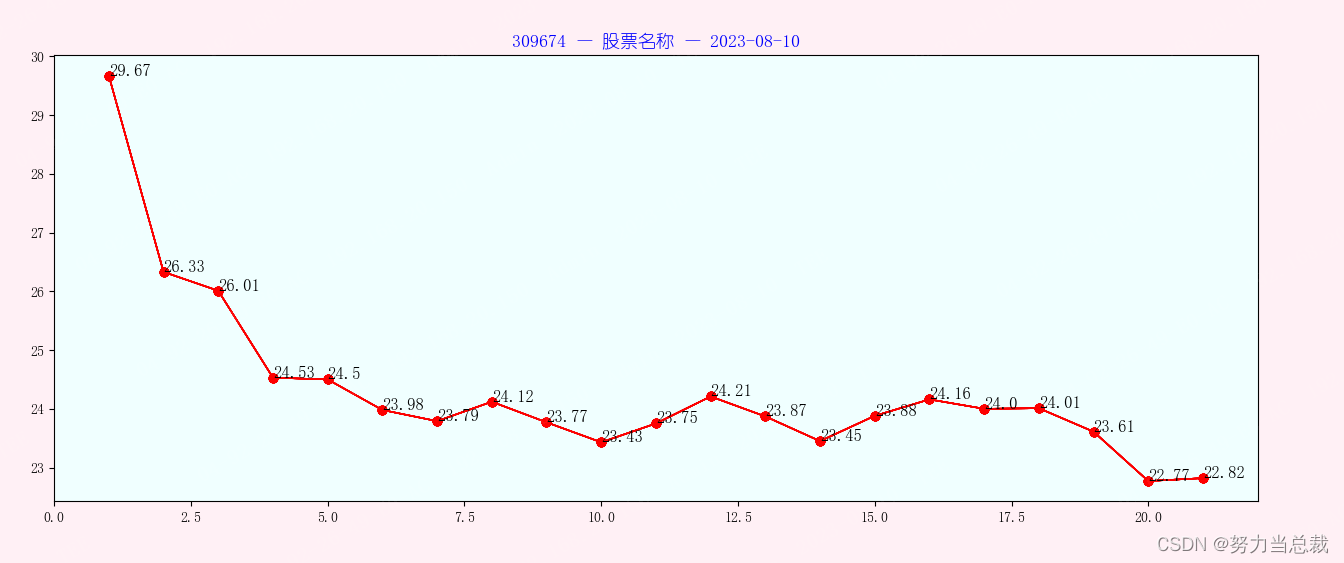
二 给画板设置颜色
只需要添加两行代码,如下所示:
import matplotlib as mpl
import matplotlib.font_manager

#print([f.name for f in matplotlib.font_manager.fontManager.ttflist])
font_name = "YouYuan"
mpl.rcParams['font.family']=font_name
mpl.rcParams['axes.unicode_minus']=False

# 以下两行代码
plt.rcParams['axes.facecolor'] = 'azure'        #设置绘图背景色
plt.rcParams['figure.facecolor'] = 'lavenderblush'      #设置背景色


datetime_now_str = datetime.datetime.now().strftime('%Y-%m-%d')
daima_name = {'301487': 'N盟固利', '309674': '股票名称', '002310': '东方园林'}
daima = '309674'
name_1 = daima_name[daima]
name = daima + " — "+ name_1 + " — " + datetime_now_str

y_list = [29.67, 26.33, 26.01, 24.53, 24.5, 23.98, 23.79, 24.12, 23.77, 23.43, 23.75, 24.21, 23.87, 23.45, 23.88, 24.16, 24.0, 24.01, 23.61, 22.77, 22.82]
x_list = [x  for x  in range(1,len(y_list)+1)]

for x, y, z in zip(x_list, y_list,y_list):
    plt.text(x, y,z, ha='left', va='bottom',fontsize=12,fontweight = "bold",verticalalignment = "baseline") # 本行应该显示默认字体
    plt.plot(x_list, y_list, 'ro--',alpha=0.5,linewidth = '1', linestyle = 'solid')
    plt.title(name, fontsize=13,color="blue",fontweight = "bold")

plt.show()
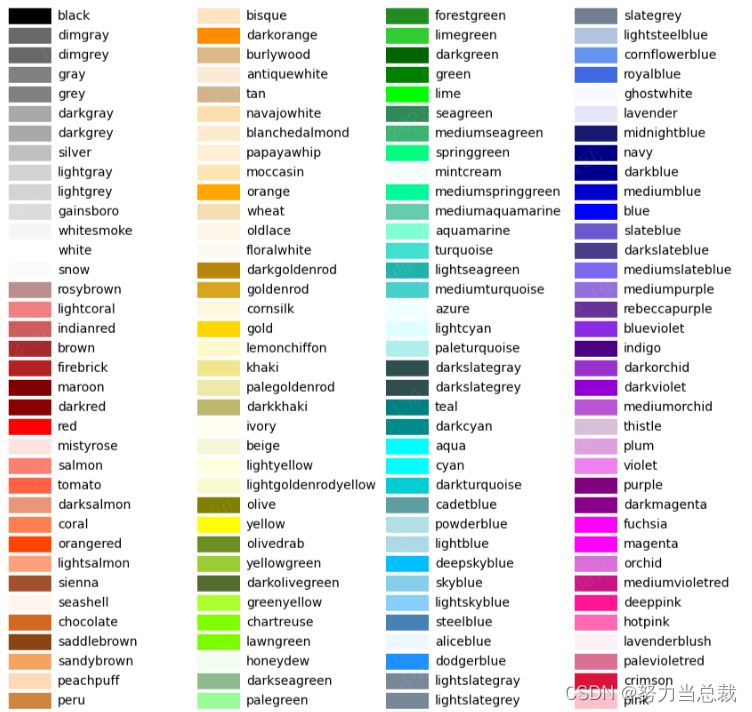
三 多种配色选择
plt.rcParams['axes.facecolor'] = 'azure'        #设置绘图背景色
plt.rcParams['figure.facecolor'] = 'lavenderblush'      #设置背景色
# 其中 = 右侧的字符串代表颜色类型,下表会给出对应的颜色及名称,根据自己喜好修改即可


 1151
1151


 到【灌水乐园】发言


