


 本文介绍了三种使用ECharts实现饼图的方法,包括设置饼图样式、动态数据更新及图表响应式布局等技巧。
引入echarts图方法在这里不做说明,大家自行官网学习~
第一种
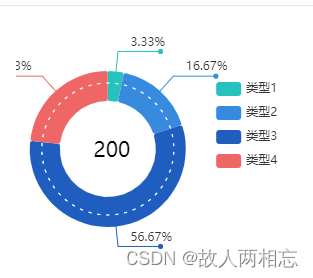
<template>
  <div id="Pie" class="Pie"></div>
</template>

<script>
import * as echarts from 'echarts'

export default {
  name: 'Pie',
  mounted() {
    // this.getPie()
  },
  data() {
    return {
      dom: null,
      visualNum: {default: 50},
      colorArr: ['#26C3BE', '#388ADE', '#1F5EBF']
    }
  },
  methods: {
    getPie() {
      if (this.dom == null) {
        let chartDom = document.getElementById('Pie')
        this.dom = echarts.init(chartDom)
      }
      this.dom.clear()

      let _data = [];
      _data.push({name: "类型1", value: 1})
      _data.push({name: "类型2", value: 5})
      _data.push({name: "类型3", value: 17})
      _data.push({name: "类型4", value: 7})


      let vData = []
      for (let i = 0; i < this.visualNum; i++) { //生成虚线圆圈
        vData.push({
          name: i,
          value: 1
        })
      }
      let centerPoint = ['30%', '50%']
      let options = {
        color: this.colorArr,
        tooltip: {
          show: false,
          trigger: 'item'
        },
        legend: {
          orient: 'vertical',
          right: '13%',
          top: '20%',
          textStyle: { //图例文字的样式
            // color: 'rgba(255,255,255,.65)'
            // fontSize: 16
          }
        },
        graphic: [
          {//环形图中间添加文字
            type: 'text',//通过不同top值可以设置上下显示
            left: '27%',
            top: '48%',
            style: {
              text: '200',
              textAlign: 'center',
              // fill: 'rgba(255,255,255,.65)',//文字的颜色
              width: 30,
              height: 30,
              fontSize: '1.5em',
              color: '#4d4f5c',
              fontFamily: 'Microsoft YaHei'
            }
          },
          {
            type: 'text',
            left: '27%',
            top: '53%',
            style: {
              // text: '全部',
              textAlign: 'center',
              // fill: 'rgba(255,255,255,.65)',//文字的颜色
              width: 30,
              height: 30,
              fontSize: '1em'
            }
          }
        ],
        series: [
          {
            type: 'pie',
            radius: ['75%', '75%'],
            itemStyle: {
              borderColor: '#FFFFFF',
              borderWidth: 3,
              // 设置扇形的阴影
              shadowBlur: 10,
              // shadowColor: 'rgba(29,60,252,0.3)'
            },
            center: centerPoint,
            label: {
              show: false
            },
            labelLine: {
              show: false
            },
            data: vData,
            z: 1
          },
          {
            name: '访问量',
            type: 'pie',
            radius: ['40%', '65%'],
            itemStyle: {
              borderRadius: 2,
              // borderColor: '#141414',
              borderWidth: 3
            },
            avoidLabelOverlap: true,
            textAlign: 'center',
            center: centerPoint,
            label: {
              show: true, //默认展示
              position: 'outside', //默认'outside'饼图扇区外侧,通过视觉引导线连到相应的扇区
              formatter: '{a|{d}%}', //格式展示{a|{b}\n{d}%}   '{a|{c} 次}'
              backgroundColor: 'inherit', //圆点颜色,auto:映射的系列色
              // height,width,lineHeight必须为0
              height: 0,
              width: 0,
              lineHeight: 0,
              // radius和padding为圆点大小,圆点半径为几radius和padding各项数值就为几如:圆点半径为1
              // borderRadius: 4,
              // padding: [4, -4, 4, -4],
              borderRadius: 2.5,
              padding: [2.5, -2.5],
              // color: '#315af0',
              rich: { // 自定义富文本样式
                a: {
                  padding: [-15, -32, 3, -30],
                  // color: '#FFFFFF'
                },
                c: {
                  padding: [0, -75, -15, -70]
                }
              }
            },
            labelLine: {
              show: true,
              length: 20, // 第一段线 长度
              length2: 40, // 第二段线 长度
              align: 'right'
            },
            data: _data,
            z: 2
          },
          {
            type: 'pie',
            center: centerPoint,
            radius: ['55%', '55%'],
            showEmptyCircle: true,
            emptyCircleStyle: {
              // color: '#FFFFFF',
              borderColor: '#FFFFFF',
              borderType: [3, 6],
              borderDashOffset: 6
            },
            itemStyle: {
              borderColor: 'rgba(0,0,0,0)',
              borderWidth: 3
            },
            label: {
              show: false
            },
            labelLine: {
              show: false
            },
            z: 3
          }

        ]
      }
      this.dom.setOption(options)
      let that = this
      window.addEventListener("resize", function () {
        that.dom.resize();
      });
    }

  }
}
</script>

<style scoped>
.Pie {
  width: 100%;
  height: 240px;
}
</style>
第二种
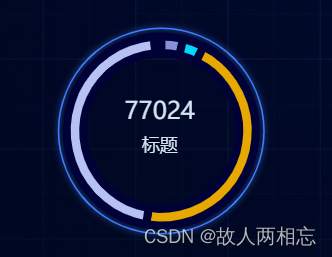
<template>
  <div id='pie'>

  </div>
</template>

<script>
import * as echarts from 'echarts';

export default {
  name: 'Pie',
  data(){
    return{

    }
  },
  mounted() {
    let data1=[{name:'标题',value:15},{name:'标题',value:31},{name:'标题',value:11},{name:'标题',value:12},{name:'标题',value:22}]
    this.init(data1)
  },
  methods:{
    init(data){

      var chartDom = document.getElementById('pie');
      var myChart = echarts.init(chartDom);
      var option;

      option = {
        color: ['#8991d6','#00d9fd','#e7a800','#b8c1f4','#3678dc','#7caeff','#7cffe2','#8800e7'],
        tooltip: {
          trigger: 'item'
        },
        graphic: {
          type: 'text',
          left: '25%',
          top: '40%',
          zlevel: 1,
          style: {
            text: '{b|112}\n\n{a|总数}',
            textAlign: 'center',
            fill: '#d5e4f3',
            rich: {
              a: {
                fontSize: 18,
              },
              b: {
                fontSize: 24,
              },

            }
          }
        },
        // -----环形图---------------------------------------
        series: [
          {
            type: 'pie',
            radius: ['52%', '63%'],
            hoverAnimation: false,
            center: ['35.5%', '50%'],
            label: {
              normal: {
                position: 'inner',
                formatter: params => {
                  return ''
                },
              }
            },
            itemStyle: {
              borderRadius: 1, // 设置每一段子项目的圆角
              borderColor: '#000137', // 设置成背景颜色
              borderWidth: 8, // 子项目间距
            },
            color: ['#8991d6','#00d9fd','#e7a800','#b8c1f4','#3678dc','#7caeff','#7cffe2','#8800e7'],
            data: data
          },
          {
            type: 'pie',
            radius: ['47%', '48%'],
            color:['#b8c1f4'],
            hoverAnimation: false,
            center: ['35.5%', '50%'],
            label: {
              normal: {
                show: false,
                position: 'inner',
                formatter: params => {
                  return ''
                },
                rich: {
                  name: {
                    color: 'rgba(236, 238, 242, 1)',
                    fontSize: 12,
                    padding: [10, 10, 0, 10],
                    fontWeight: '400'
                  },
                  hr: {
                    borderColor: 'rgba(63, 127, 255, 0.2)',
                    width: '100%',
                    borderWidth: 1,
                    height: 0
                  },
                  cir: {
                    fontSize: 18,
                    padding: [10, 10, 0, 10]
                  }
                },
              }
            },
            data: [1]
          },
          // 外层白盘---------------------------------------------------
          {
            itemStyle: {
              normal: {
                color: 'rgba(63, 127, 255, 1)',
                shadowBlur: 6,
                shadowColor: 'rgba(63, 127, 255, 1)',
                shadowOffsetX: 0,
                shadowOffsetY: 0
              }
            },
            type: 'pie',
            silent: true, // 取消高亮
            radius: ['68%', '69%'],
            center: ['35.5%', '50%'],
            hoverAnimation: false, // 取消动画效果
            data: [1],
            label: {
              normal: {
                show: false,
                position: 'inner',
                formatter: params => {
                  return (
                    '{percent|' + params.percent.toFixed(0) + '%}'
                  )
                },
                rich: {
                  name: {
                    color: 'rgba(236, 238, 242, 1)',
                    fontSize: 12,
                    padding: [10, 10, 0, 10],
                    fontWeight: '400'
                  },
                  hr: {
                    borderColor: 'rgba(63, 127, 255, 0.2)',
                    width: '100%',
                    borderWidth: 1,
                    height: 0
                  },
                  cir: {
                    fontSize: 18,
                    padding: [10, 10, 0, 10]
                  }
                },
              }
            },
            z: -1
          }
        ]
      }
      option && myChart.setOption(option);
    }
  }
}
</script>

<style scoped>
#pie{
  width: 100%;
  height: 300px;
}
</style>
第三种
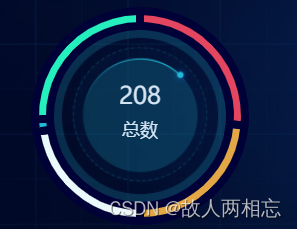
<template>
<div id='pie'>

</div>
</template>

<script>
import * as echarts from 'echarts'

export default {
  name: 'Pie',
  data(){
    return{

    }
  },
  mounted() {
    let data1=[{name:'标题',value:55},{name:'标题',value:22},{name:'标题',value:25},{name:'标题',value:4},{name:'标题',value:53}]
    this.init(data1)
  },
  methods:{
    init(data){
      var chartDom = document.getElementById('pie');
      var myChart = echarts.init(chartDom);
      var option;

      option ={
        tooltip: {
          trigger: 'item' // 鼠标悬浮显示
        },
        graphic: [
          {
            type: 'image',  // 插入圆环中间的图片
            style: {
              image: require('/src/images/1.png'), // 本地图片要用require引入
              width: 180, // 设置图片大小
              height: 180
            },
            // 设置图片位置
            left: 'center',
            top: '20%'
          },
          { //环形图中间添加文字
            type: 'text', //通过不同top值可以设置上下显示
            left: 'center',
            top: '40%',
            style: {
              text: '208',
              textAlign: 'center',
              fill: '#d5e4f3', //文字的颜色
              width: 30,
              height: 30,
              fontSize: 24,
            }
          },
          // 写了两个文字插入是因为业务要求两行不一样样式的字
          { //环形图中间添加文字
            type: 'text', //通过不同top值可以设置上下显示
            left: 'center',
            top: '52%',
            style: {
              text: '总数',
              textAlign: 'center',
              fill: '#d5e4f3', //文字的颜色
              width: 30,
              height: 30,
              fontSize: 18,
              fontFamily: ""
            }
          }
        ],
        color: ['#e44660', '#e4a746', '#eaf9fb', '#21bad6', '#25efbd'], // 圆环的颜色组
        series: [
          {
            name: '',
            type: 'pie',
            radius: ['60%', '70%'],
// avoidLabelOverlap: false,
            itemStyle: {
              borderRadius: 1, // 设置每一段子项目的圆角
              borderColor: '#000137', // 设置成背景颜色
              borderWidth: 8, // 子项目间距
            },
            label: {
              show: false,
              position: 'center'
            },
            labelLine: {
              show: false
            },
            data: data
          }
        ]
      }
      option && myChart.setOption(option);
    }
  }
}
</script>

<style scoped>
#pie{
  width: 100%;
  height: 240px;
}
</style>


 1861
1861

 被折叠的 条评论
为什么被折叠?
被折叠的 条评论
为什么被折叠?
 到【灌水乐园】发言


