


配置虚拟机

删除
解决方案
关闭Hyper-v服务
管理员身份打开CMD
bcdedit /set hypervisorlaunchtype off
重启电脑,运行vm即可
恢复Hyper-v服务
bcdedit /set hypervisorlaunchtype auto
账号:node1 密码:123456
192.168.137.40
pysparkspark的官网
pyspark.SparkContext.parallelize — PySpark 3.5.0 documentation
getNumPartitions():统计分区数
去重后,分区数不变。除非指定分区数-
spark过程内容
第五章
Parquet是一种列式存储格式,它被设计用于在大规模数据处理环境中高效地存储和处理数据。Parquet文件将数据按照列而非行的方式进行存储,这意味着每个列的数据是连续存储的,这种方式使得Parquet文件更加紧凑和高效。
Parquet文件的好处包括:
-
高效压缩:Parquet文件支持多种压缩算法,可以将数据压缩到非常小的大小,从而减少存储空间和网络传输带宽的使用。
-
快速读取:由于Parquet文件是按列存储的,因此可以只读取需要的列,而不必读取整个文件,从而提高读取速度。
-
跨平台支持:Parquet文件可以在多种不同的数据处理框架和编程语言中使用,如Hadoop、Spark、Python等。
-
数据类型支持:Parquet文件支持多种数据类型,包括复杂类型如嵌套结构和数组,这使得它适合存储各种类型的数据。
-
列式存储的优势:列式存储可以减少不必要的I/O,提高查询效率,特别是在数据量较大时,可以显著提高查询速度。
总之,Parquet是一种高效的列式存储格式,它可以提高数据处理和存储的效率,特别是在大规模数据处理环境中。
node1@node1:~$ pyspark
>>> rdd=sc.parallelize([('Michael',29),('Andy',30),('Justin',19)])
>>> rdd.collect()
[('Michael', 29), ('Andy', 30), ('Justin', 19)]
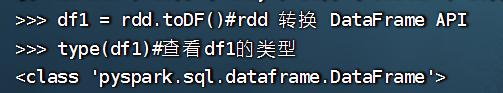
>>> df1=rdd.toDF()
>>> type(df1)
<class 'pyspark.sql.dataframe.DataFrame'>
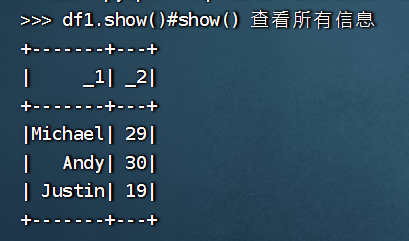
>>> df1.show()
+-------+---+
| _1| _2|
+-------+---+
|Michael| 29|
| Andy| 30|
| Justin| 19|
+-------+---+
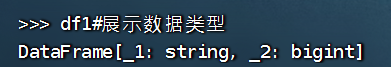
>>> df1
DataFrame[_1: string, _2: bigint]
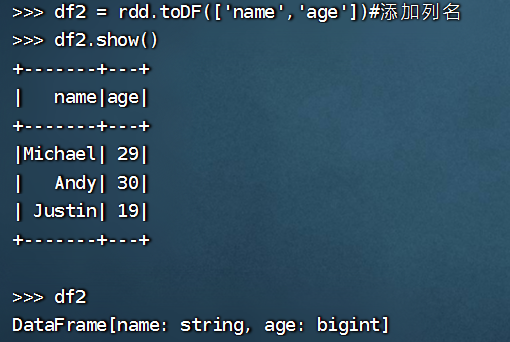
>>> df2=rdd.toDF(['name','age'])
>>> df2.show()
+-------+---+
| name|age|
+-------+---+
|Michael| 29|
| Andy| 30|
| Justin| 19|
+-------+---+
>>> df2
DataFrame[name: string, age: bigint]
>>> df3=df.toDF("name: string, age: int")
Traceback (most recent call last):
File "<stdin>", line 1, in <module>
NameError: name 'df' is not defined
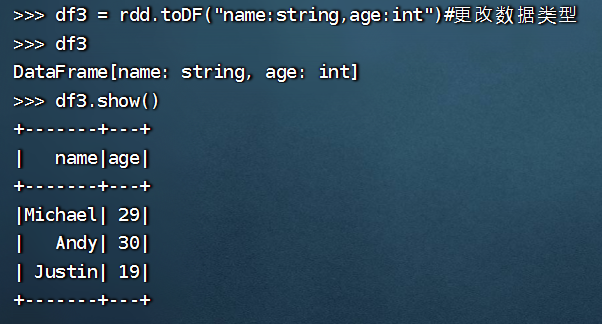
>>> df3=rdd.toDF("name: string, age: int")
>>> df3
DataFrame[name: string, age: int]
>>> df3.show()
+-------+---+
| name|age|
+-------+---+
|Michael| 29|
| Andy| 30|
| Justin| 19|
+-------+---+
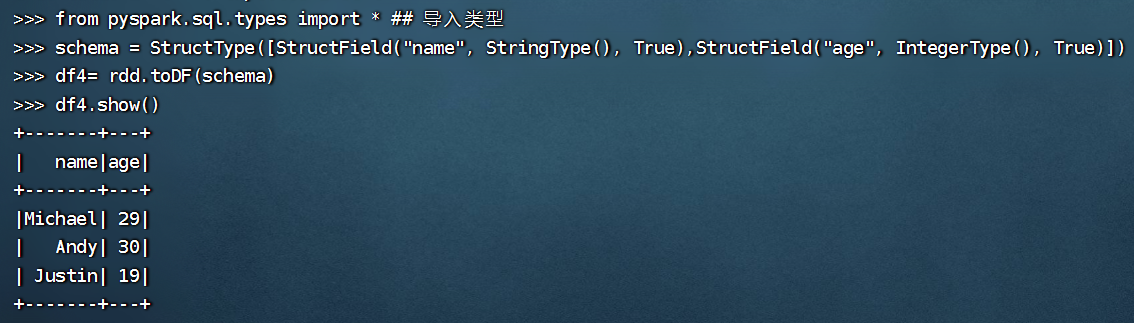
>>> from pyspark.sql.types import *
>>> schema = StructType([StructField("name", StringType(), True),StructField("age", IntegerType(), True)])
>>> df = rdd1.toDF(schema)
Traceback (most recent call last):
File "<stdin>", line 1, in <module>
NameError: name 'rdd1' is not defined
>>> df4= rdd.toDF(schema)
>>> df4.show()
+-------+---+
| name|age|
+-------+---+
|Michael| 29|
| Andy| 30|
| Justin| 19|
+-------+---+
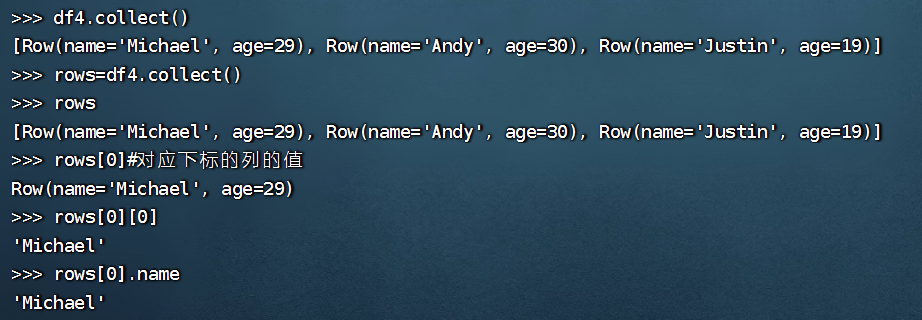
>>> df4.collect()
[Row(name='Michael', age=29), Row(name='Andy', age=30), Row(name='Justin', age=19)]
>>> rows=df4.collect()
>>> rows
[Row(name='Michael', age=29), Row(name='Andy', age=30), Row(name='Justin', age=19)]
>>> rows[0]
Row(name='Michael', age=29)
>>> rows[0][0]
'Michael'
>>> rows[0].name
'Michael'
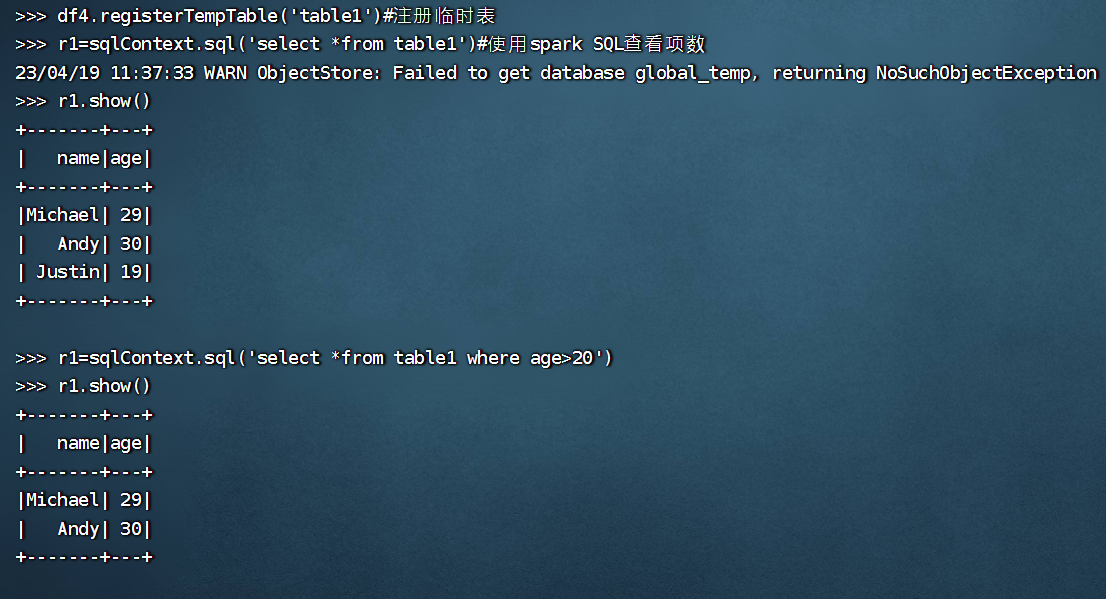
>>> df4.registerTempTable('table1')
>>> sqlContext.sql('select *from table1')
23/04/19 09:39:25 WARN ObjectStore: Failed to get database global_temp, returning NoSuchObjectException
DataFrame[name: string, age: int]
>>> r1=sqlContext.sql('select *from table1')
>>> r1.show()
+-------+---+
| name|age|
+-------+---+
|Michael| 29|
| Andy| 30|
| Justin| 19|
+-------+---+
>>> r1=sqlContext.sql('select *from table1 where age>20')
>>> r1.show()
+-------+---+
| name|age|
+-------+---+
|Michael| 29|
| Andy| 30|
+-------+---+
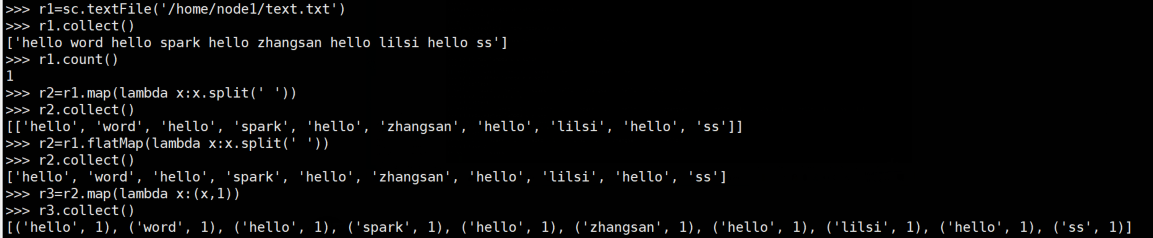
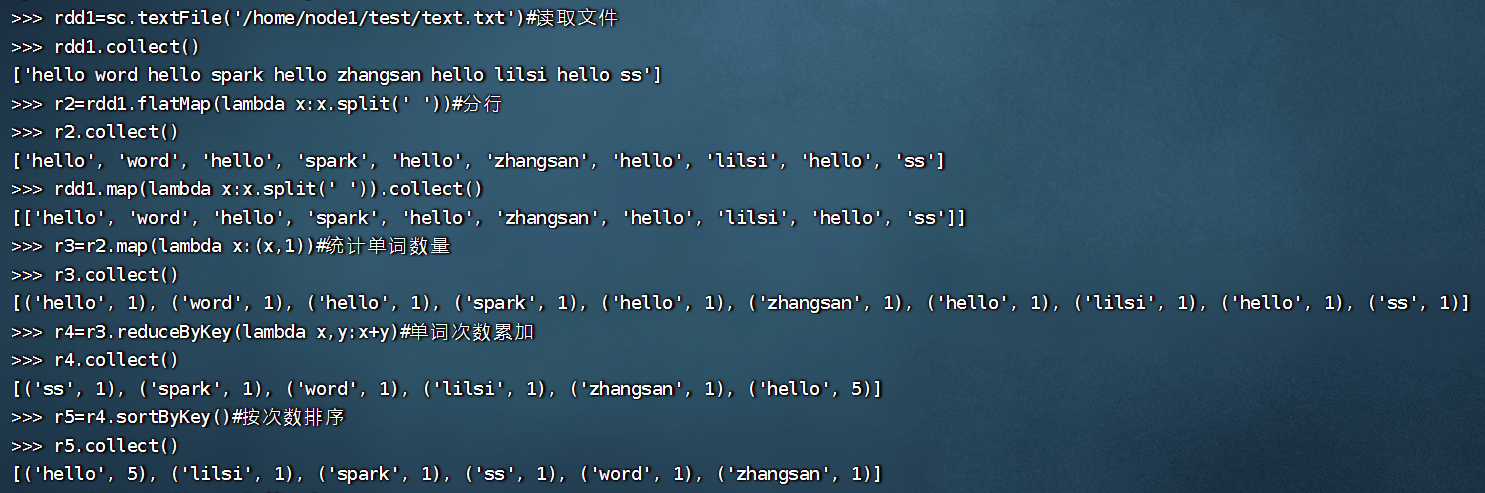
>>> rdd1=sc.textFile('/home/node1/test/text.txt')
>>> rdd1.collect()
['hello word hello spark hello zhangsan hello lilsi hello ss']
>>> r2=rdd1.flatMap(lambda x:x.split(' '))
>>> r2.collect()
['hello', 'word', 'hello', 'spark', 'hello', 'zhangsan', 'hello', 'lilsi', 'hello', 'ss']
>>> rdd1.map(lambda x:x.split(' ')).collect()
[['hello', 'word', 'hello', 'spark', 'hello', 'zhangsan', 'hello', 'lilsi', 'hello', 'ss']]
>>> r3=r2.map(lambda x:(x,1))
>>> r3.collect()
[('hello', 1), ('word', 1), ('hello', 1), ('spark', 1), ('hello', 1), ('zhangsan', 1), ('hello', 1), ('lilsi', 1), ('hello', 1), ('ss', 1)]
>>> r4=r3.reduceByKey(lambda x,y:x+y)
>>> r4.collect()
[('ss', 1), ('spark', 1), ('word', 1), ('lilsi', 1), ('zhangsan', 1), ('hello', 5)]
>>> r5=r4.sortByKey()
>>> r5.collect()
[('hello', 5), ('lilsi', 1), ('spark', 1), ('ss', 1), ('word', 1), ('zhangsan', 1)]
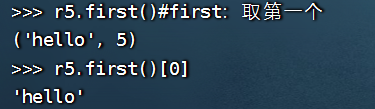
>>> r5.first()
('hello', 5)
>>> r5.first()[0]
'hello'
>>> r2.collect()
['hello', 'word', 'hello', 'spark', 'hello', 'zhangsan', 'hello', 'lilsi', 'hello', 'ss']
>>> from pyspark.sql.types import *
>>> schema = StructType([StructField("name", StringType(), True)])
>>> df1=r2.toDF(schema)
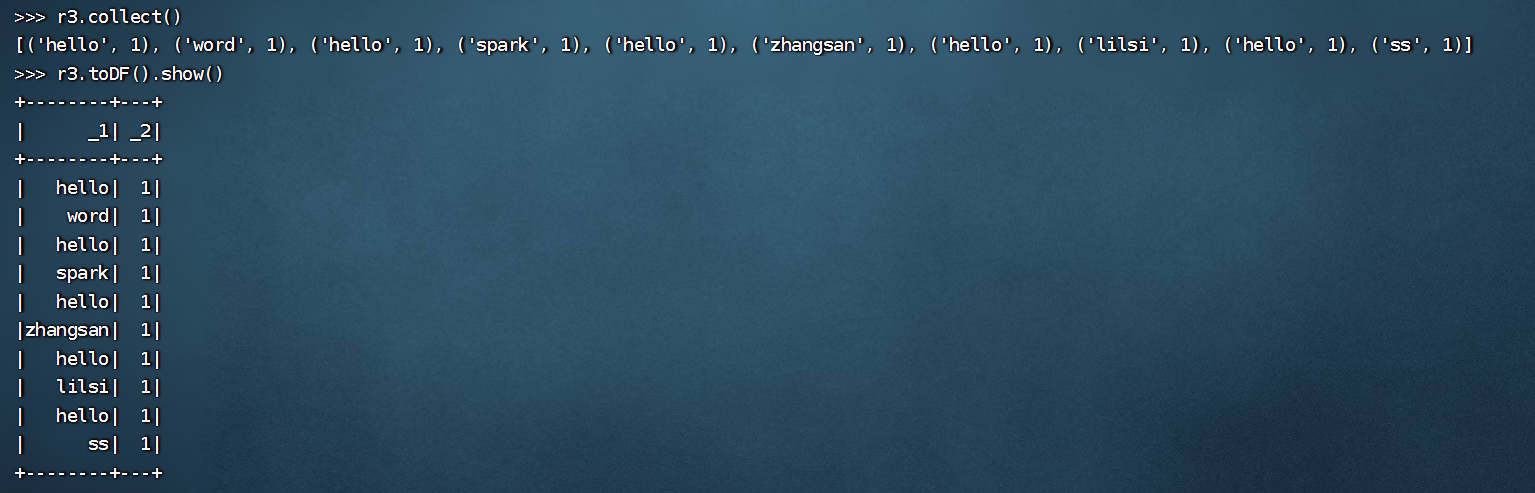
>>> r3.collect()
[('hello', 1), ('word', 1), ('hello', 1), ('spark', 1), ('hello', 1), ('zhangsan', 1), ('hello', 1), ('lilsi', 1), ('hello', 1), ('ss', 1)]
>>> r3.toDF().show()
+--------+---+
| _1| _2|
+--------+---+
| hello| 1|
| word| 1|
| hello| 1|
| spark| 1|
| hello| 1|
|zhangsan| 1|
| hello| 1|
| lilsi| 1|
| hello| 1|
| ss| 1|
+--------+---+
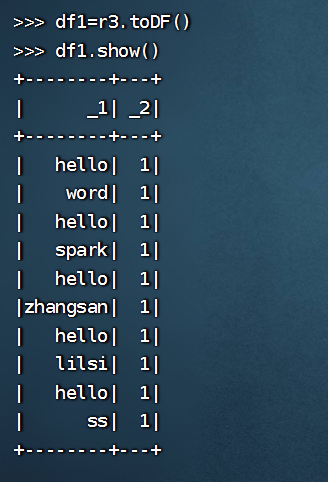
>>> df1=r3.toDF()
>>> df1.show()
+--------+---+
| _1| _2|
+--------+---+
| hello| 1|
| word| 1|
| hello| 1|
| spark| 1|
| hello| 1|
|zhangsan| 1|
| hello| 1|
| lilsi| 1|
| hello| 1|
| ss| 1|
+--------+---+
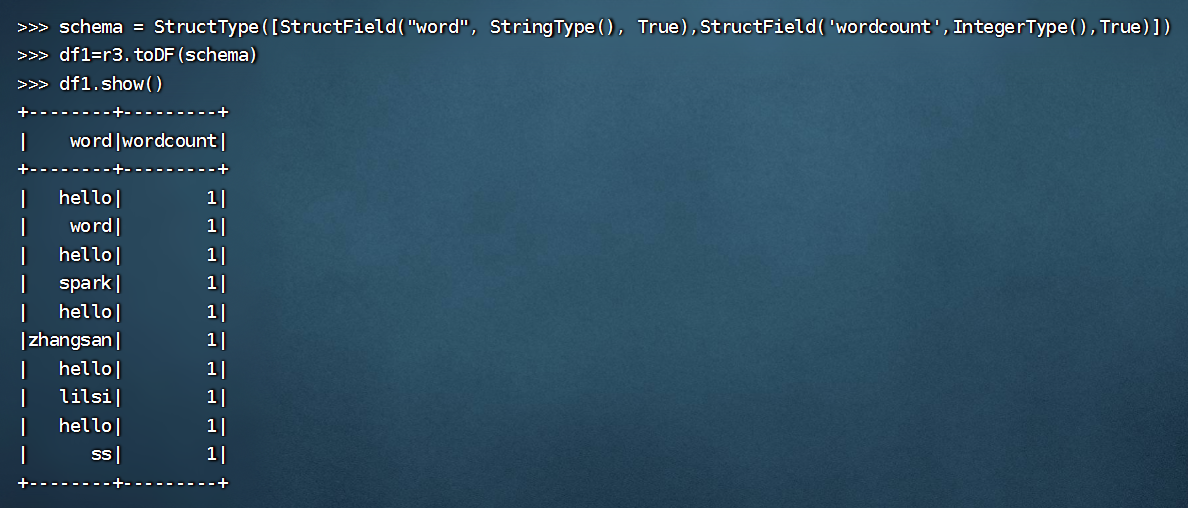
>>> schema = StructType([StructField("word", StringType(), True),StructField('wordcount',IntegerType(),True)])
>>> df1=r3.toDF(schema)
>>> df1.show()
+--------+---------+
| word|wordcount|
+--------+---------+
| hello| 1|
| word| 1|
| hello| 1|
| spark| 1|
| hello| 1|
|zhangsan| 1|
| hello| 1|
| lilsi| 1|
| hello| 1|
| ss| 1|
+--------+---------+
>>> df1.registerTempTable('tbword')
>>> r1=sqlContext.sql('select count(wordcount) from tbword group by word ')
>>> r1
DataFrame[count(wordcount): bigint]
>>> r1=sqlContext.sql('select word, count(wordcount) from tbword group by word ')
>>> r1
DataFrame[word: string, count(wordcount): bigint]
>>> r1.collect()
[Row(word='ss', count(wordcount)=1), Row(word='hello', count(wordcount)=5), Row(word='zhangsan', count(wordcount)=1), Row(word='spark', count(wordcount)=1), Row(word='word', count(wordcount)=1), Row(word='lilsi', count(wordcount)=1)]
>>> r1=sqlContext.sql('select word, count(wordcount) as co from tbword group by word order by co desc ')
>>> r1.show()
+--------+---+
| word| co|
+--------+---+
| hello| 5|
| ss| 1|
| spark| 1|
| word| 1|
|zhangsan| 1|
| lilsi| 1|
+--------+---+
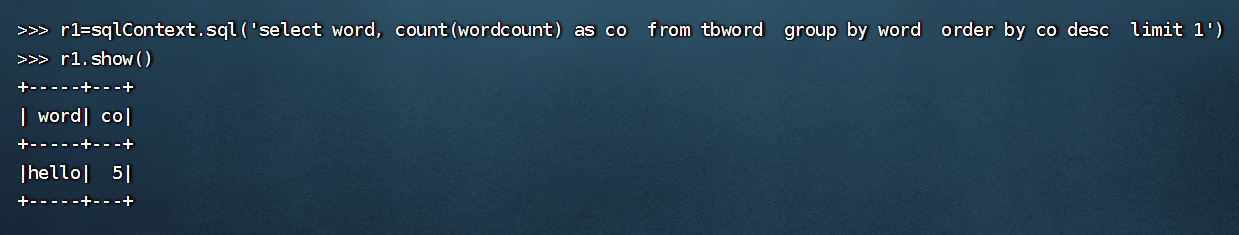
>>> r1=sqlContext.sql('select word, count(wordcount) as co from tbword group by word order by co desc limit 1')
>>> r1.show()
+-----+---+
| word| co|
+-----+---+
|hello| 5|
+-----+---+
>>> 

查询所有-select(列名)
(3)排序查询
orderBy/sort("列名")升序排列
orderBy/sort(“列名”.desc) 降序排列
orderBy/sort($“列1” , $“列2”.desc) 按两列排序

LIMIT StartIndex,Length
其中:StartIndex表示起始位置,Length表示取几个
>>> df=spark.read.format('csv').load('/home/node1/Input/us-counties.csv')
>>> df.show()
+---------+-----------+----------+-----+------+
|      _c0|        _c1|       _c2|  _c3|   _c4|
+---------+-----------+----------+-----+------+
|     date|     county|     state|cases|deaths|
|2020/1/21|  Snohomish|Washington|    1|     0|
|2020/1/22|  Snohomish|Washington|    1|     0|
|2020/1/23|  Snohomish|Washington|    1|     0|
|2020/1/24|       Cook|  Illinois|    1|     0|
|2020/1/24|  Snohomish|Washington|    1|     0|
|2020/1/25|     Orange|California|    1|     0|
|2020/1/25|       Cook|  Illinois|    1|     0|
|2020/1/25|  Snohomish|Washington|    1|     0|
|2020/1/26|   Maricopa|   Arizona|    1|     0|
|2020/1/26|Los Angeles|California|    1|     0|
|2020/1/26|     Orange|California|    1|     0|
|2020/1/26|       Cook|  Illinois|    1|     0|
|2020/1/26|  Snohomish|Washington|    1|     0|
|2020/1/27|   Maricopa|   Arizona|    1|     0|
|2020/1/27|Los Angeles|California|    1|     0|
|2020/1/27|     Orange|California|    1|     0|
|2020/1/27|       Cook|  Illinois|    1|     0|
|2020/1/27|  Snohomish|Washington|    1|     0|
|2020/1/28|   Maricopa|   Arizona|    1|     0|
+---------+-----------+----------+-----+------+
only showing top 20 rows

>>> df=spark.read.format('csv').option('header','true').load('/home/node1/Input/us-counties.csv')
>>> df.show()
+---------+-----------+----------+-----+------+
|     date|     county|     state|cases|deaths|
+---------+-----------+----------+-----+------+
|2020/1/21|  Snohomish|Washington|    1|     0|
|2020/1/22|  Snohomish|Washington|    1|     0|
|2020/1/23|  Snohomish|Washington|    1|     0|
|2020/1/24|       Cook|  Illinois|    1|     0|
|2020/1/24|  Snohomish|Washington|    1|     0|
|2020/1/25|     Orange|California|    1|     0|
|2020/1/25|       Cook|  Illinois|    1|     0|
|2020/1/25|  Snohomish|Washington|    1|     0|
|2020/1/26|   Maricopa|   Arizona|    1|     0|
|2020/1/26|Los Angeles|California|    1|     0|
|2020/1/26|     Orange|California|    1|     0|
|2020/1/26|       Cook|  Illinois|    1|     0|
|2020/1/26|  Snohomish|Washington|    1|     0|
|2020/1/27|   Maricopa|   Arizona|    1|     0|
|2020/1/27|Los Angeles|California|    1|     0|
|2020/1/27|     Orange|California|    1|     0|
|2020/1/27|       Cook|  Illinois|    1|     0|
|2020/1/27|  Snohomish|Washington|    1|     0|
|2020/1/28|   Maricopa|   Arizona|    1|     0|
|2020/1/28|Los Angeles|California|    1|     0|
+---------+-----------+----------+-----+------+
only showing top 20 rows

>>> df.shape()
Traceback (most recent call last):
  File "<stdin>", line 1, in <module>
  File "/home/node1/Spark/spark/python/pyspark/sql/dataframe.py", line 1301, in __getattr__
    "'%s' object has no attribute '%s'" % (self.__class__.__name__, name))
AttributeError: 'DataFrame' object has no attribute 'shape'
>>> df.count()
158981
>>> df.columns
['date', 'county', 'state', 'cases', 'deaths']
>>> len(df.columns)
5
>>> df.registerTempTable('table1')
>>> spark.sql('select   *  from table1 ')
23/04/26 08:58:37 WARN ObjectStore: Failed to get database global_temp, returning NoSuchObjectException
DataFrame[date: string, county: string, state: string, cases: string, deaths: string]
>>> r=spark.sql('select   *  from table1 ')
>>> r.show()
+---------+-----------+----------+-----+------+
|     date|     county|     state|cases|deaths|
+---------+-----------+----------+-----+------+
|2020/1/21|  Snohomish|Washington|    1|     0|
|2020/1/22|  Snohomish|Washington|    1|     0|
|2020/1/23|  Snohomish|Washington|    1|     0|
|2020/1/24|       Cook|  Illinois|    1|     0|
|2020/1/24|  Snohomish|Washington|    1|     0|
|2020/1/25|     Orange|California|    1|     0|
|2020/1/25|       Cook|  Illinois|    1|     0|
|2020/1/25|  Snohomish|Washington|    1|     0|
|2020/1/26|   Maricopa|   Arizona|    1|     0|
|2020/1/26|Los Angeles|California|    1|     0|
|2020/1/26|     Orange|California|    1|     0|
|2020/1/26|       Cook|  Illinois|    1|     0|
|2020/1/26|  Snohomish|Washington|    1|     0|
|2020/1/27|   Maricopa|   Arizona|    1|     0|
|2020/1/27|Los Angeles|California|    1|     0|
|2020/1/27|     Orange|California|    1|     0|
|2020/1/27|       Cook|  Illinois|    1|     0|
|2020/1/27|  Snohomish|Washington|    1|     0|
|2020/1/28|   Maricopa|   Arizona|    1|     0|
|2020/1/28|Los Angeles|California|    1|     0|
+---------+-----------+----------+-----+------+
only showing top 20 rows

>>> r=spark.sql('select   state,sum(cases) as sumCases,sum(deaths) as sumDeaths  from table1  group by state')
>>> r.show()
+--------------------+---------+---------+
|               state| sumCases|sumDeaths|
+--------------------+---------+---------+
|                Utah| 205581.0|   1998.0|
|              Hawaii|  28266.0|    595.0|
|           Minnesota| 282491.0|  14724.0|
|                Ohio| 755119.0|  38465.0|
|Northern Mariana ...|    689.0|     92.0|
|              Oregon| 115862.0|   4336.0|
|            Arkansas| 134312.0|   2759.0|
|               Texas|1282385.0|  33806.0|
|        North Dakota|  44513.0|    962.0|
|        Pennsylvania|1970295.0| 102387.0|
|         Connecticut|1116652.0|  86078.0|
|            Nebraska| 201088.0|   2794.0|
|             Vermont|  40628.0|   2049.0|
|              Nevada| 222290.0|  10034.0|
|         Puerto Rico|  71061.0|   3568.0|
|          Washington| 707111.0|  37088.0|
|            Illinois|2316059.0|  98378.0|
|            Oklahoma| 158406.0|   8861.0|
|      Virgin Islands|   3028.0|    150.0|
|District of Columbia| 190158.0|   8726.0|
+--------------------+---------+---------+
only showing top 20 rows

>>> r=spark.sql('select   state,sum(cases) as sumCases,sum(deaths) as sumDeaths  from table1  group by state  order by sumCases desc limit 1')
>>> r.show()
+--------+-----------+---------+
|   state|   sumCases|sumDeaths|
+--------+-----------+---------+
|New York|1.3231107E7| 937038.0|
+--------+-----------+---------+

>>> r.w
r.where(              r.withColumn(         r.withColumnRenamed(  r.withWatermark(      r.write
>>> r.write.option('header','true').csv('/home/node1/test3')
第六章
spark streaming:微批处理
第七章
机器学习的步骤:
获取数据——特征工程(使数据处于同一水平下进行处理)——选择模型——模型预测——模型训练——数据保存
机器学习的本质:
一个数学公式(未知到已知)
监督学习(有标签)
-
分类:离散型数据(固定值)
-
回归:连续型数据(任何值)
分类的基础模型器(5种)
-
knn
-
朴素贝叶斯
-
决策树
-
逻辑回归
-
向量机
转换器:DataFrame到一个新的DataFrame(已知函数——结果)
评估器:生成一个已知函数(未知)
评估器生成转换器
管道:包含一系列的阶段,每一个阶段是一个转换器或一个评估器
MLlib发展
从Spark2.0开始,软件包中基于RDD的API spark.mllib已进入维护模式。
Spark的主要机器学习API现在是包中基于DataFrame的API spark.ml。
DataFram=表结构+数据(rdd)
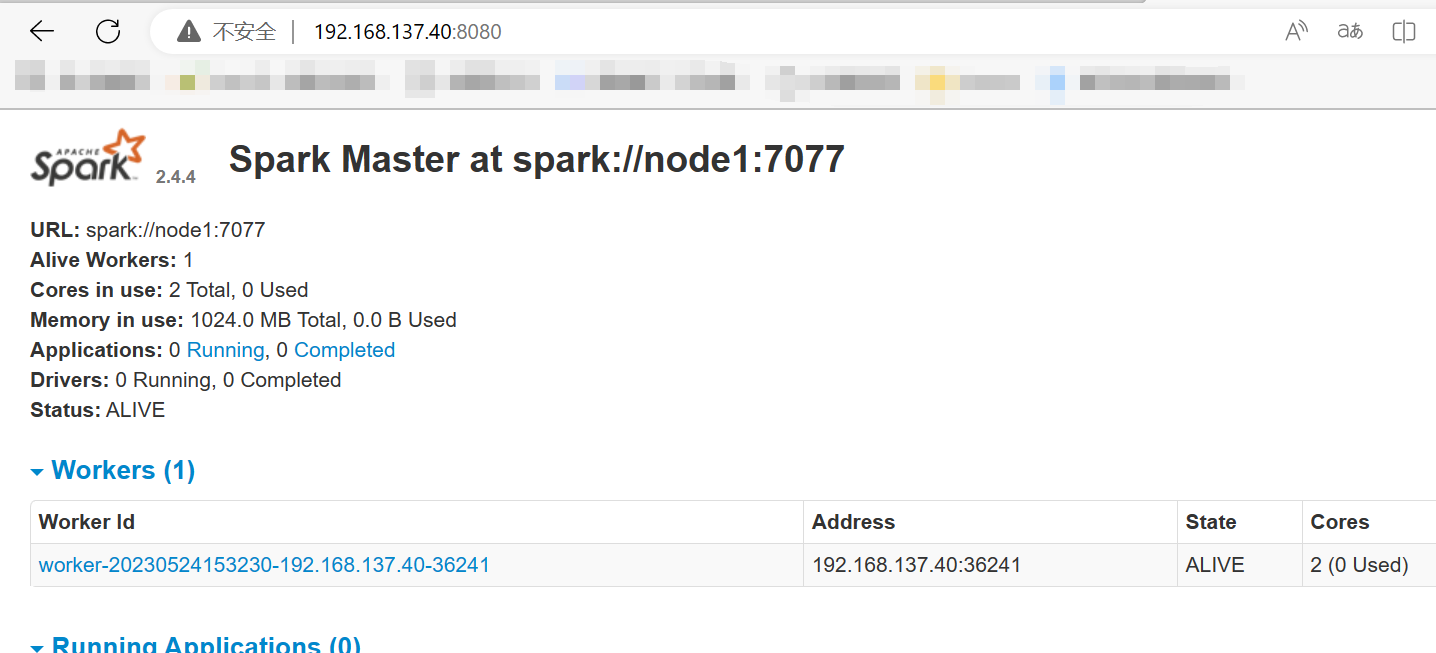
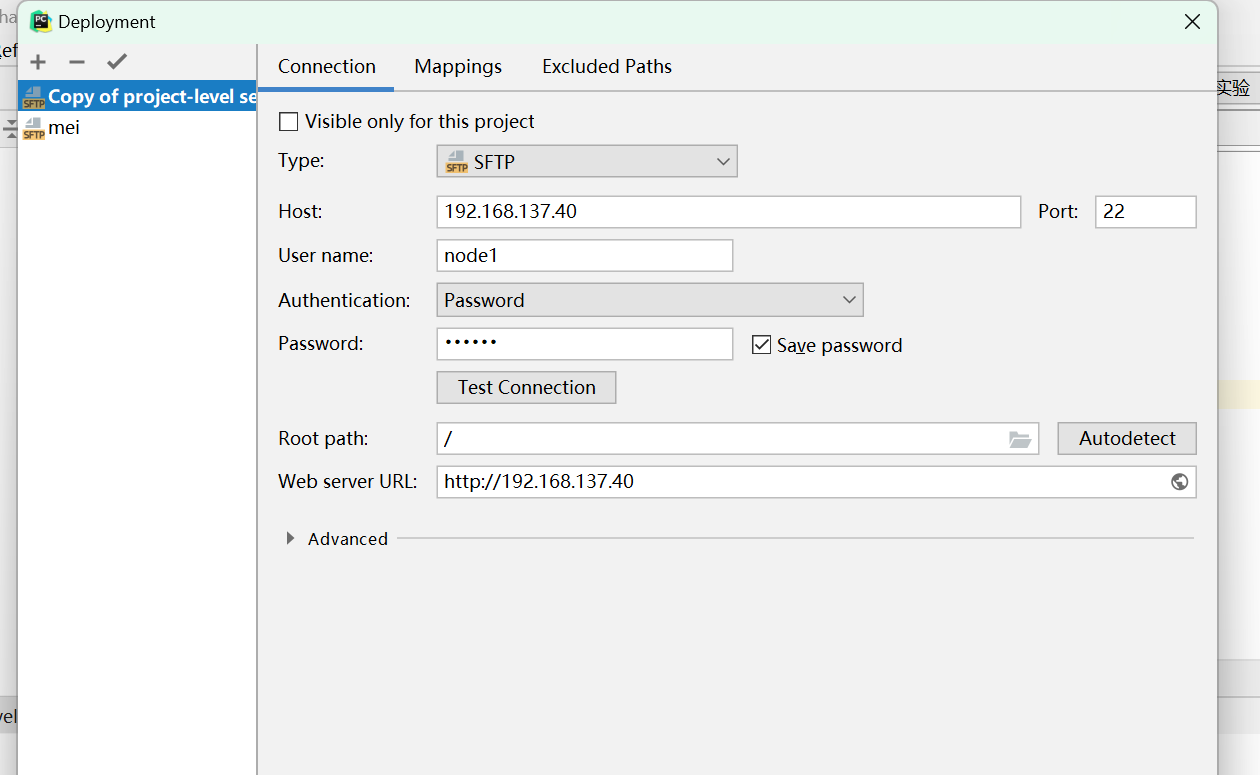
pycharm远程控制pyspark
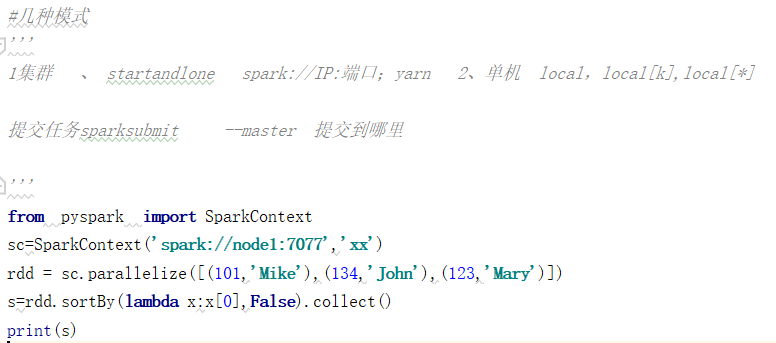
sc:定义—找网站:192.168.137.40:8080
'xx':名字

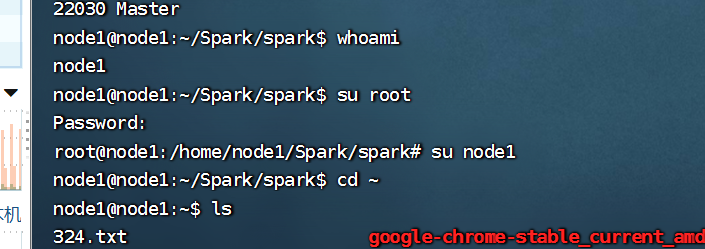
whoami:用户名是什么;su:更改名称

whereis:查找在哪里
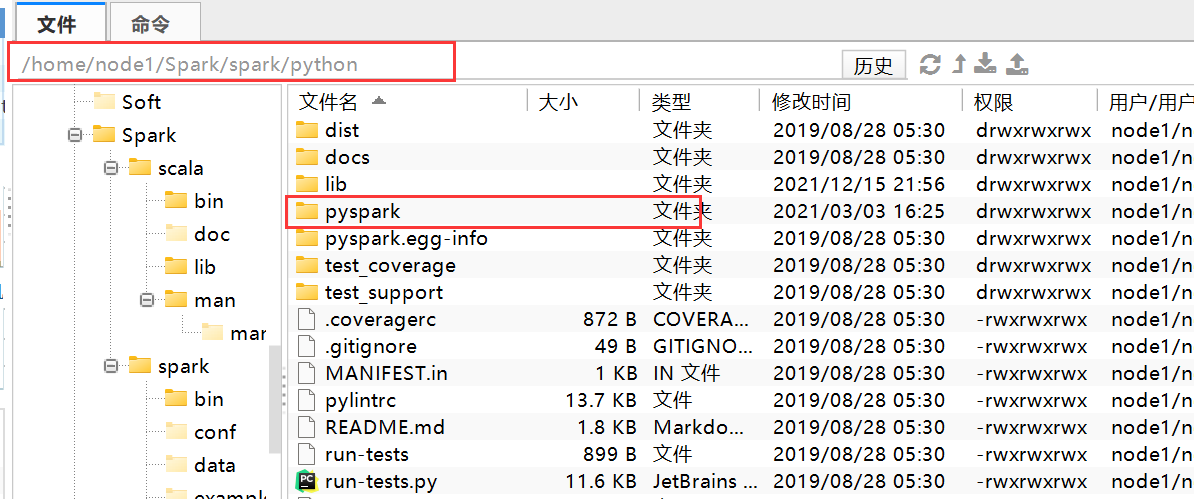

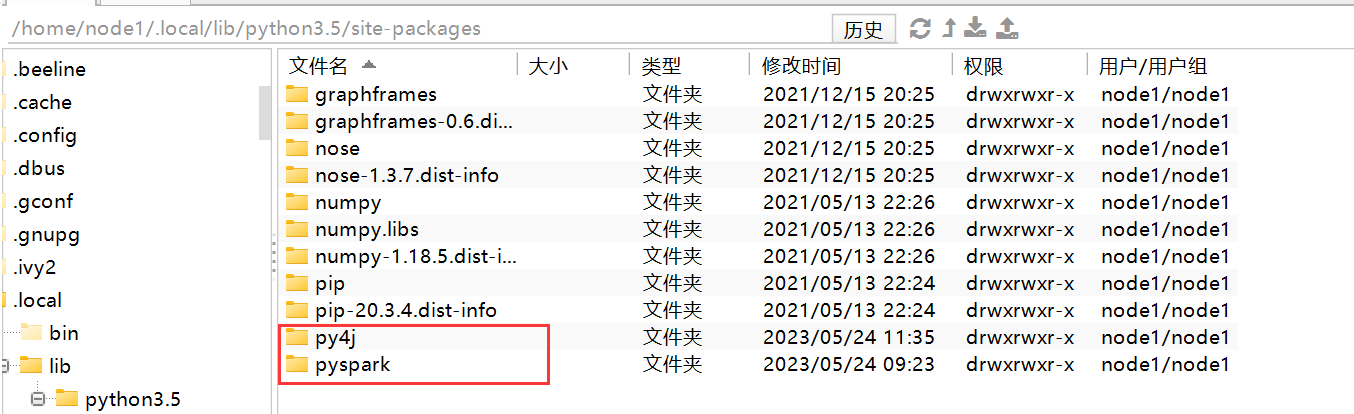
查找
找到py4j和pyspark,上传到下面的路径中
第八章
图计算——分布式
GraphFrames--基于DataFrame(处理)
pyspark:交互命令
先注册表
默认保存格式——帕(列式存储方式)
代码-虚拟机
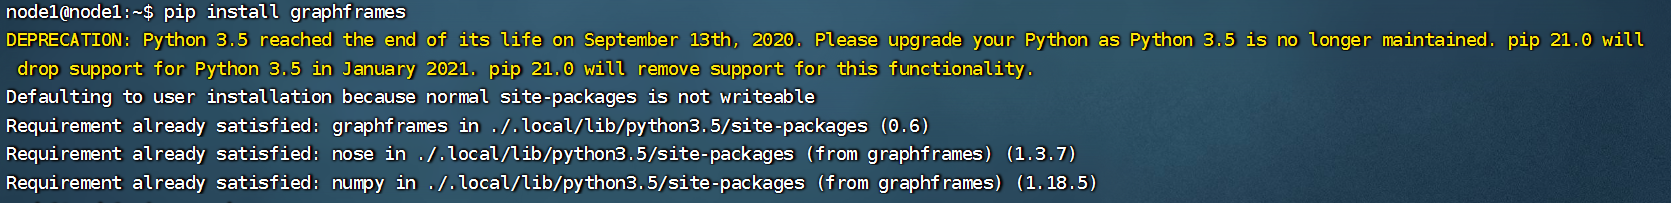
先安装graphframes
>>> vertices = spark.createDataFrame([("a", "Alice", 34), ("b", "Bob", 36), ("e", "Leo", 35), ("c", "Tom", 12), ("d", "Jack", 13)], ["id", "name", "age"])
>>> vertices.show()
+---+-----+---+
| id| name|age|
+---+-----+---+
|  a|Alice| 34|
|  b|  Bob| 36|
|  e|  Leo| 35|
|  c|  Tom| 12|
|  d| Jack| 13|
+---+-----+---+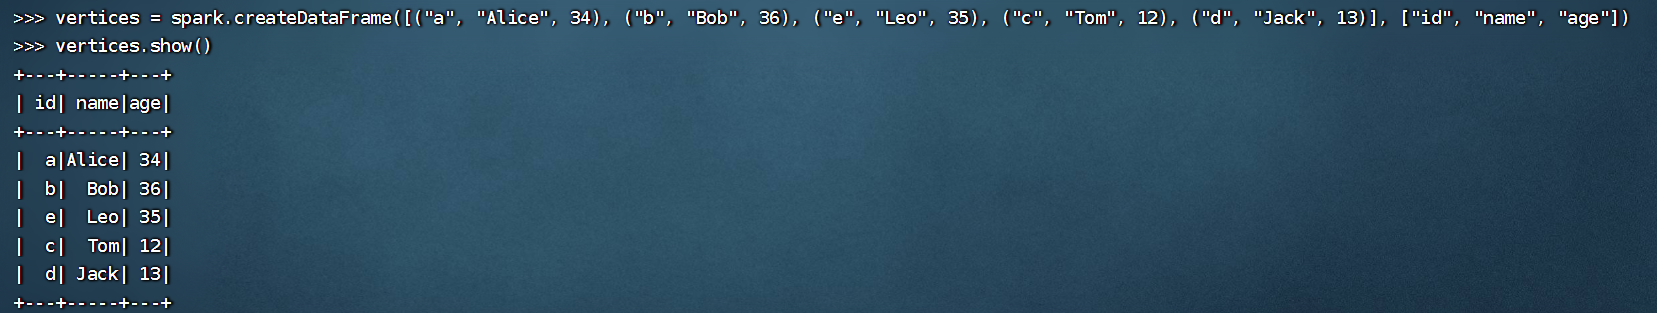
这段代码是用来创建 Spark 中的图数据中的顶点(Vertices)DataFrame。具体地,其中包含了五个人员信息,分别是 "a"、"b"、"e"、"c" 和 "d",他们的姓名分别是 "Alice"、"Bob"、"Leo"、"Tom" 和 "Jack",年龄分别是 34、36、35、12 和 13。最后一行代码 vertices.show() 是用来打印这个 DataFrame 的内容,方便查看。
>>> edges = spark.createDataFrame([("a", "b", "friend"), ("a", "e", "friend"), ("b", "e", "friend"), ("b", "c", "father"), ("c", "d", "classmate")], ["src", "dst", "relationship"])
>>> edges.show()
+---+---+------------+
|src|dst|relationship|
+---+---+------------+
|  a|  b|      friend|
|  a|  e|      friend|
|  b|  e|      friend|
|  b|  c|      father|
|  c|  d|   classmate|
+---+---+------------+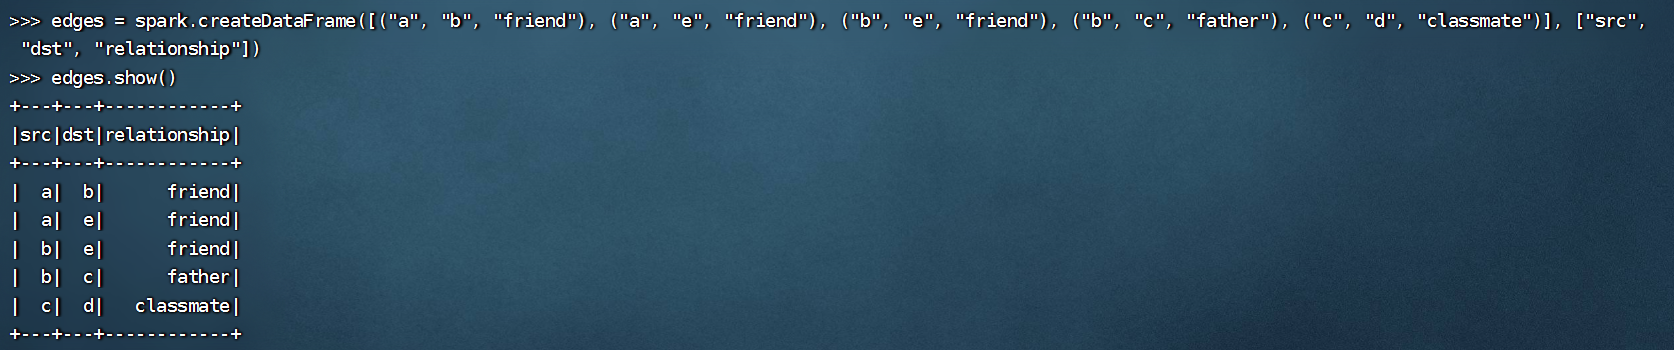
这段代码是用来创建 Spark 中的图数据中的边(Edges)DataFrame。具体地,其中包含了五条边信息,分别是 "a" 和 "b" 之间的 "friend" 关系,"a" 和 "e" 之间的 "friend" 关系,"b" 和 "e" 之间的 "friend" 关系,"b" 和 "c" 之间的 "father" 关系,"c" 和 "d" 之间的 "classmate" 关系。最后一行代码 edges.show() 是用来打印这个 DataFrame 的内容,方便查看。
>>> from  graphframes import GraphFrame
>>> graph = GraphFrame(vertices, edges)
>>> type(graph)
<class 'graphframes.graphframe.GraphFrame'>
>>> type(graph.vertices)
<class 'pyspark.sql.dataframe.DataFrame'>
>>> graph.vertices.show()
+---+-----+---+
| id| name|age|
+---+-----+---+
|  a|Alice| 34|
|  b|  Bob| 36|
|  e|  Leo| 35|
|  c|  Tom| 12|
|  d| Jack| 13|
+---+-----+---+
这段代码是用来创建一个 GraphFrame 对象,其中包含了上一步创建的顶点 DataFrame 和边 DataFrame。GraphFrame 是 Spark 中的一个图处理库,可以方便地进行图分析和处理。type(graph) 是用来查看 graph 对象的类型,可以看到它是 GraphFrame 类型。type(graph.vertices) 是用来查看 graph.vertices 对象的类型,可以看到它是 DataFrame 类型。最后一行代码 graph.vertices.show() 是用来打印 graph.vertices 的内容,方便查看。
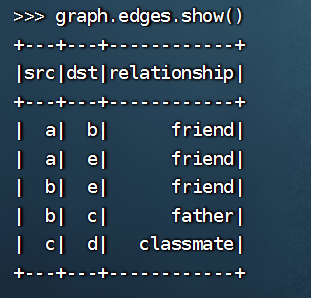
>>> graph.edges.show()
+---+---+------------+
|src|dst|relationship|
+---+---+------------+
|  a|  b|      friend|
|  a|  e|      friend|
|  b|  e|      friend|
|  b|  c|      father|
|  c|  d|   classmate|
+---+---+------------+
>>> graph.triplets.show()
+--------------+-----------------+-------------+
|           src|             edge|          dst|
+--------------+-----------------+-------------+
|  [b, Bob, 36]|   [b, e, friend]| [e, Leo, 35]|
|[a, Alice, 34]|   [a, e, friend]| [e, Leo, 35]|
|  [c, Tom, 12]|[c, d, classmate]|[d, Jack, 13]|
|  [b, Bob, 36]|   [b, c, father]| [c, Tom, 12]|
|[a, Alice, 34]|   [a, b, friend]| [b, Bob, 36]|
+--------------+-----------------+-------------+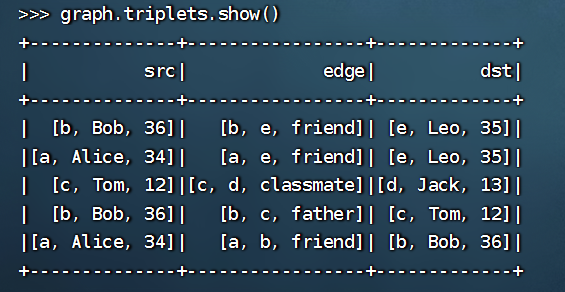
这段代码是用来打印 GraphFrame 中的三元组(triplets)信息,即包含了顶点和边的信息。其中,每个三元组包含了源顶点、目标顶点和它们之间的边的信息。graph.triplets.show() 是用来显示这些三元组信息的。
>>> graph.degrees
DataFrame[id: string, degree: int]
>>> graph.degrees.show()
+---+------+
| id|degree|
+---+------+
|  e|     2|
|  d|     1|
|  c|     2|
|  b|     3|
|  a|     2|
+---+------+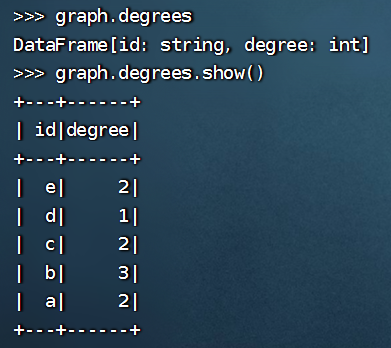
这段代码是用来计算图中每个顶点的度数(degree),即与该顶点直接相连的边的数量。graph.degrees 返回一个 DataFrame,其中包含每个顶点的 ID 和对应的度数。最后一行代码 graph.degrees.show() 是用来打印这个 DataFrame 的内容,方便查看。
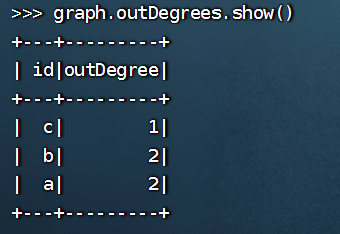
>>> graph.outDegrees.show()
+---+---------+
| id|outDegree|
+---+---------+
|  c|        1|
|  b|        2|
|  a|        2|
+---+---------+
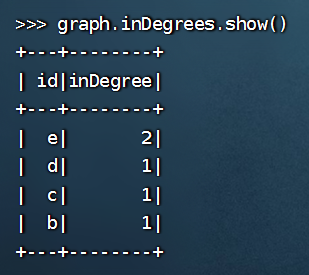
>>> graph.inDegrees.show()
+---+--------+
| id|inDegree|
+---+--------+
|  e|       2|
|  d|       1|
|  c|       1|
|  b|       1|
+---+--------+
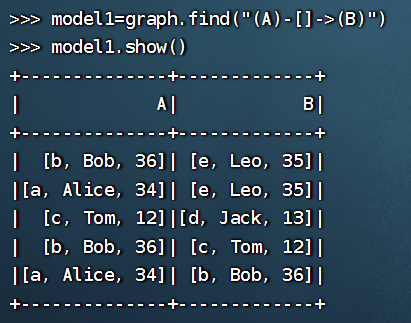
>>> model1=graph.find("(A)-[e]->(B)")
>>> model1.show()
+--------------+-----------------+-------------+
|             A|                e|            B|
+--------------+-----------------+-------------+
|  [b, Bob, 36]|   [b, e, friend]| [e, Leo, 35]|
|[a, Alice, 34]|   [a, e, friend]| [e, Leo, 35]|
|  [c, Tom, 12]|[c, d, classmate]|[d, Jack, 13]|
|  [b, Bob, 36]|   [b, c, father]| [c, Tom, 12]|
|[a, Alice, 34]|   [a, b, friend]| [b, Bob, 36]|
+--------------+-----------------+-------------+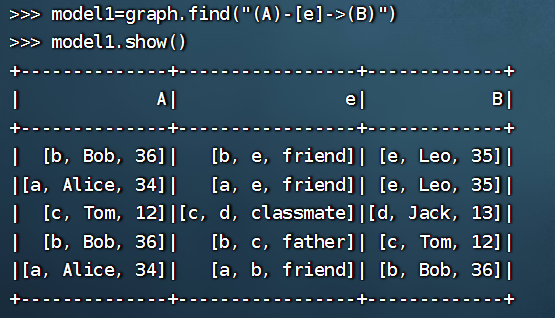
这段代码是用来查找 GraphFrame 中所有从顶点 A 到顶点 B 的路径,并将这些路径表示为一个 DataFrame。其中,"(A)-[e]->(B)" 是一个 Spark SQL 查询语句,用来指定查询的模式,其中 A 和 B 表示顶点的 ID,e 表示边的关系。最后一行代码 model1.show() 是用来打印这个 DataFrame 的内容,方便查看。
>>> model1=graph.find("(A)-[]->(B)")
>>> model1.show()
+--------------+-------------+
|             A|            B|
+--------------+-------------+
|  [b, Bob, 36]| [e, Leo, 35]|
|[a, Alice, 34]| [e, Leo, 35]|
|  [c, Tom, 12]|[d, Jack, 13]|
|  [b, Bob, 36]| [c, Tom, 12]|
|[a, Alice, 34]| [b, Bob, 36]|
+--------------+-------------+
这段代码是用来查找 GraphFrame 中所有从顶点 A 到顶点 B 的路径,并将这些路径表示为一个 DataFrame。其中,"(A)-[]->(B)" 是一个 Spark SQL 查询语句,用来指定查询的模式,其中 A 和 B 表示顶点的 ID,[] 表示两个顶点之间的关系,这里没有指定具体的边的类型。最后一行代码 model1.show() 是用来打印这个 DataFrame 的内容,方便查看。
>>> model1=graph.find("(a)-[e]->(b);(b)-[e2]->(c)")
>>> model1.show()
+--------------+--------------+------------+-----------------+-------------+
|             a|             e|           b|               e2|            c|
+--------------+--------------+------------+-----------------+-------------+
|[a, Alice, 34]|[a, b, friend]|[b, Bob, 36]|   [b, e, friend]| [e, Leo, 35]|
|  [b, Bob, 36]|[b, c, father]|[c, Tom, 12]|[c, d, classmate]|[d, Jack, 13]|
|[a, Alice, 34]|[a, b, friend]|[b, Bob, 36]|   [b, c, father]| [c, Tom, 12]|
+--------------+--------------+------------+-----------------+-------------+
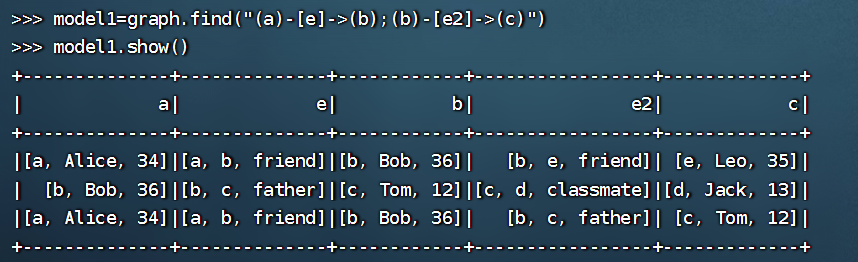
这段代码是用来查找 GraphFrame 中所有满足以下条件的路径,并将这些路径表示为一个 DataFrame:
-
路径的起点为顶点 a;
-
路径的终点为顶点 c;
-
路径经过顶点 b,并且从顶点 a 到顶点 b 之间存在一条边 e,从顶点 b 到顶点 c 之间存在一条边 e2。
其中,"(a)-[e]->(b);(b)-[e2]->(c)" 是一个 Spark SQL 查询语句,用来指定查询的模式。最后一行代码 model1.show() 是用来打印这个 DataFrame 的内容,方便查看。
>>> model1
DataFrame[a: struct<id:string,name:string,age:bigint>, e: struct<src:string,dst:string,relationship:string>, b: struct<id:string,name:string,age:bigint>, e2: struct<src:string,dst:string,relationship:string>, c: struct<id:string,name:string,age:bigint>]
>>> type(model1)
<class 'pyspark.sql.dataframe.DataFrame'>
>>> model1.filter("c.age>30").show()
+--------------+--------------+------------+--------------+------------+
|             a|             e|           b|            e2|           c|
+--------------+--------------+------------+--------------+------------+
|[a, Alice, 34]|[a, b, friend]|[b, Bob, 36]|[b, e, friend]|[e, Leo, 35]|
+--------------+--------------+------------+--------------+------------+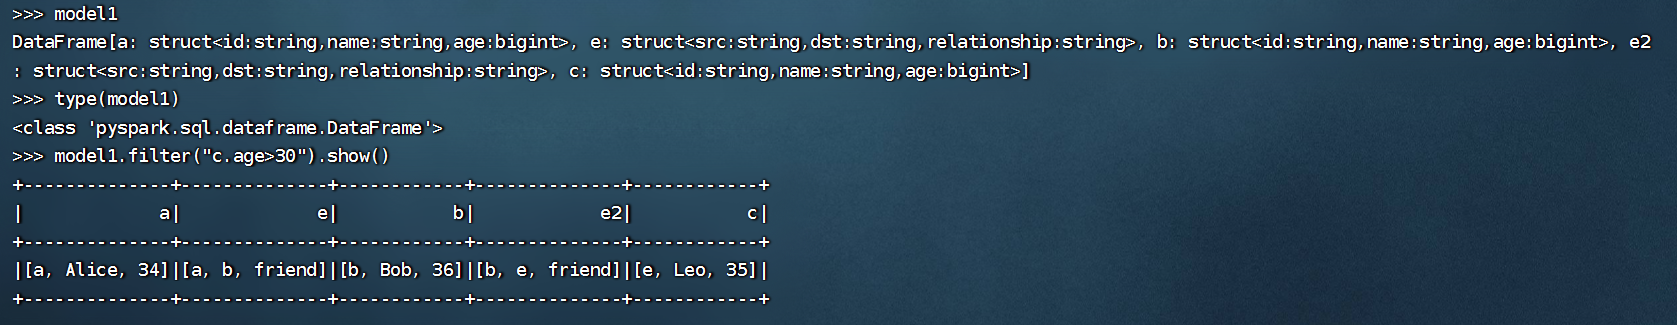
- `model1` 是一个 DataFrame,其中存储了从顶点 a 到顶点 c 的路径信息。
- `type(model1)` 是用来检查 `model1` 的数据类型,输出为 `<class 'pyspark.sql.dataframe.DataFrame'>`,表示 `model1` 是一个 DataFrame 对象。
- `model1.filter("c.age>30").show()` 是用来过滤满足条件 "c.age>30" 的路径,并将这些路径表示为一个新的 DataFrame,并打印输出。其中 `filter()` 方法是 DataFrame 的一个操作,用来筛选满足指定条件的行。这里的条件是 "c.age>30",表示要求顶点 c 的属性 age 大于 30。最后的 `show()` 方法是用来打印新生成的 DataFrame 的内容。
>>> graph.bfs("name='Bob'","age<32").show()
+------------+--------------+------------+
|        from|            e0|          to|
+------------+--------------+------------+
|[b, Bob, 36]|[b, c, father]|[c, Tom, 12]|
+------------+--------------+------------+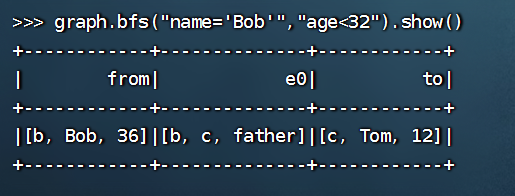
这段代码是用来执行 GraphFrame 中的广度优先搜索(BFS)算法,并将搜索结果表示为一个 DataFrame。其中,"name='Bob'" 是查询中起始节点的筛选条件,表示要求起始节点的属性 name 的值等于 "Bob";"age<32" 是查询中目标节点的筛选条件,表示要求目标节点的属性 age 值小于 32。
广度优先搜索算法会从起始节点开始,逐层搜寻与其直接相连的节点。代码中的查询条件会限制搜索的范围,只有满足条件的节点才会被搜索到。最后的 `show()` 方法用来打印搜索结果的内容。
>>> graph.shortestPaths(landmarks=['a'])
DataFrame[id: string, name: string, age: bigint, distances: map<string,int>]
>>> graph.shortestPaths(landmarks=['a']).show()
+---+-----+---+---------+
| id| name|age|distances|
+---+-----+---+---------+
|  b|  Bob| 36|       []|
|  e|  Leo| 35|       []|
|  a|Alice| 34| [a -> 0]|
|  d| Jack| 13|       []|
|  c|  Tom| 12|       []|
+---+-----+---+---------+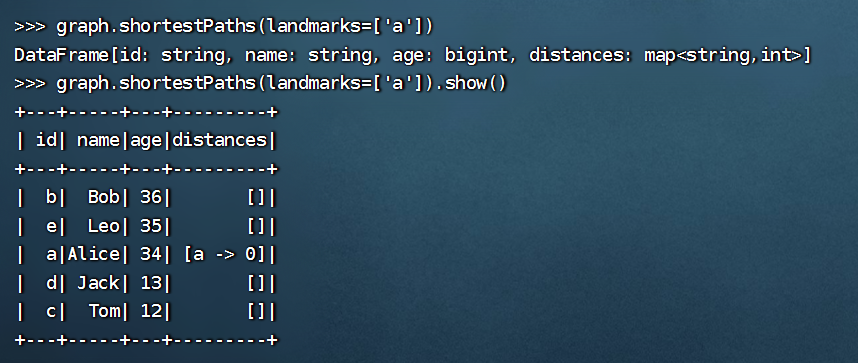
这段代码是用来执行 GraphFrame 中的最短路径算法,并将算法结果表示为一个 DataFrame。其中,landmarks=['a'] 表示以顶点 a 为起点,计算出从顶点 a 到其他顶点的最短路径。如果 landmarks 中有多个顶点,则会分别以这些顶点为起点,计算出从这些顶点到其他顶点的最短路径。
第一行代码 graph.shortestPaths(landmarks=['a']) 是执行最短路径算法,但是没有打印输出结果。第二行代码 graph.shortestPaths(landmarks=['a']).show() 是执行最短路径算法,并将结果打印输出。其中的 show() 方法用来打印 DataFrame 的内容,方便查看。
>>> graph.shortestPaths(landmarks=['e']).show()
+---+-----+---+---------+
| id| name|age|distances|
+---+-----+---+---------+
|  b|  Bob| 36| [e -> 1]|
|  e|  Leo| 35| [e -> 0]|
|  a|Alice| 34| [e -> 1]|
|  d| Jack| 13|       []|
|  c|  Tom| 12|       []|
+---+-----+---+---------+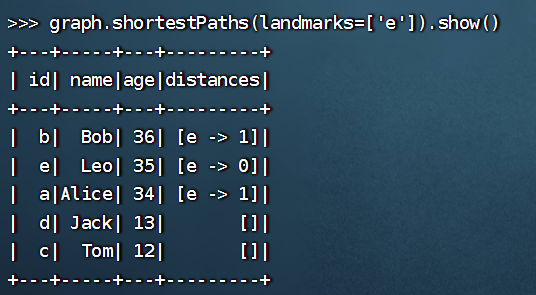
这段代码是用来执行 GraphFrame 中的最短路径算法,并将算法结果表示为一个 DataFrame。其中,landmarks=['e'] 表示以顶点 e 为起点,计算出从顶点 e 到其他顶点的最短路径。如果 landmarks 中有多个顶点,则会分别以这些顶点为起点,计算出从这些顶点到其他顶点的最短路径。
最后的 show() 方法用来打印 DataFrame 的内容,方便查看。
>>> graph.triangleCount().show()
+-----+---+-----+---+
|count| id| name|age|
+-----+---+-----+---+
|    1|  e|  Leo| 35|
|    0|  d| Jack| 13|
|    0|  c|  Tom| 12|
|    1|  b|  Bob| 36|
|    1|  a|Alice| 34|
+-----+---+-----+---+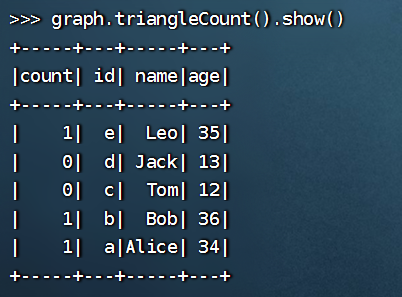
这段代码是用来执行 GraphFrame 中的三角形计数算法,并将算法结果表示为一个 DataFrame。三角形计数算法用来计算图中三角形的数量,即由三个顶点和三条边组成的子图的数量。
graph.triangleCount() 表示执行三角形计数算法。最后的 show() 方法用来打印 DataFrame 的内容,方便查看。
>>> sc.setCheckpointDir('/home/node1/tmp/checkpoint')
>>> graph.connectedComponents().show()
+---+-----+---+------------+
| id| name|age|   component|
+---+-----+---+------------+
|  a|Alice| 34|670014898176|
|  b|  Bob| 36|670014898176|
|  e|  Leo| 35|670014898176|
|  c|  Tom| 12|670014898176|
|  d| Jack| 13|670014898176|
+---+-----+---+------------+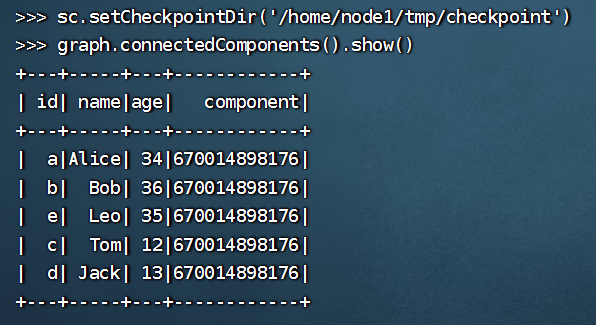
这段代码是用来执行 GraphFrame 中的连通组件算法,并将算法结果表示为一个 DataFrame。其中,sc.setCheckpointDir('/home/node1/tmp/checkpoint') 是设置 Spark 的 checkpoint 目录,用于存储中间结果,以便加速计算。graph.connectedComponents() 表示执行连通组件算法,用来计算图中的连通组件,并将结果表示为一个 DataFrame。
最后的 show() 方法用来打印 DataFrame 的内容,方便查看。连通组件算法会将图中的顶点划分为若干个连通组件,同一连通组件中的顶点可以通过边相互到达,不同连通组件中的顶点则无法相互到达。
>>> r=graph.pageRank(maxIter=4)
>>> type(r)
<class 'graphframes.graphframe.GraphFrame'>
>>> r.vertices.show()
+---+-----+---+------------------+
| id| name|age|          pagerank|
+---+-----+---+------------------+
|  b|  Bob| 36|0.8455938256815745|
|  e|  Leo| 35|1.2049712015962437|
|  a|Alice| 34|0.5933991759168944|
|  d| Jack| 13|1.4032592449737233|
|  c|  Tom| 12|0.9527765518315635|
+---+-----+---+------------------+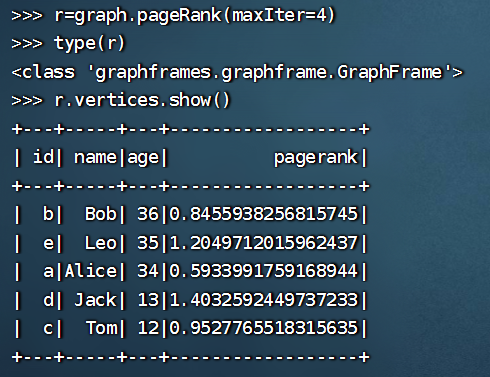
这段代码是用来执行 GraphFrame 中的 PageRank 算法,并将算法结果表示为一个 DataFrame。其中,r = graph.pageRank(maxIter=4) 表示执行 PageRank 算法,最大迭代次数为 4,将结果保存在变量 r 中。maxIter 参数表示 PageRank 算法的最大迭代次数,可以根据需要进行修改。
type(r) 表示获取变量 r 的数据类型,这里返回的数据类型是 GraphFrame 的 PagerankResult 类型。r.vertices.show() 表示显示 PageRank 算法的结果,该结果包括图中每个顶点的 PageRank 值。其中,vertices 表示获取算法结果中的顶点信息,show() 方法用来打印 DataFrame 的内容,方便查看。
spark汇总
程序设计:
-
加载数据生成df
1、引用:from pyspark.sql.types import *
2、创建schema:schema=StructType([StructField('id',IntegerType(),True),StructField('lat',StringType(),True),StructField('lon',StringType(),True),StructField('time',IntegerType(),True)])
3、加载生成df
-
将df注册成一张临时表:df=spark.read.cvs('home/node1/Test/5/taxi.csv',schema)
-
SQL操作


 1660
1660

 被折叠的 条评论
为什么被折叠?
被折叠的 条评论
为什么被折叠?
 到【灌水乐园】发言


