


一、饼图

const option = {
          tooltip: {
            trigger: 'item'
          },
          legend: {
            bottom: 10,
            itemWidth: 12,
            itemHeight: 12,
            itemGap: 30,
            textStyle: {
              color: '#405B84'
            }
          },
          grid: {
            left: '3%',
            right: '4%',
            bottom: '10%',
            containLabel: true
          },
          color: ['#68A0F7', '#64DEF3', '#40CE66', '#F87F4C'],
          series: [
            {
              name: '总数',
              type: 'pie',
              label: {
                color: '#405B84',
                formatter: '{b}: {d}%'
              },
              data: [
                {
                  value: 335,
                  name: '40分钟以上'
                },
                {
                  value: 234,
                  name: '35-40分钟'
                },
                {
                  value: 335,
                  name: '30-35分钟'
                },
                {
                  value: 1234,
                  name: '30分钟以下'
                }
              ],
              radius: '65%'
            }
          ]
        };
二、环形图

const option = {
            tooltip: {
                trigger: 'item'
            },
            legend: {
                bottom: 10,
                itemWidth: 12,
                itemHeight: 12,
                itemGap: 30,
                textStyle: {
                    color: '#405B84'
                }
            },
            grid: {
                left: '3%',
                right: '4%',
                bottom: '10%',
                containLabel: true
            },
            color: ['#68A0F7', '#64DEF3', '#40CE66', '#F87F4C'],
            series: [
                {
                    name: '总数',
                    type: 'pie',
                    label: {
                        color: '#405B84',
                        formatter: '{b}: {d}%'
                    },
                    data: [
                        {
                            value: 335,
                            name: '优秀'
                        },
                        {
                            value: 234,
                            name: '良好'
                        },
                        {
                            value: 335,
                            name: '合格'
                        },
                        {
                            value: 1234,
                            name: '较差'
                        }
                    ],
                    radius: ['50%', '70%']
                }
            ]
        };

<template>
  <div
    :ref="`echartsComponent${random}`"
    :style="{ 'width': width, 'height': height }"
  >
  </div>
</template>

<script>
  import { createRandomId } from '@/util/util'
  export default {
    computed: {
      random: function () {
        return createRandomId()
      }
    },
    props: {
      width: {
        default: '100%',
        type: String
      },
      height: {
        default: '100%',
        type: String
      },
      data: {
        type: [Number, String],
        default: '0.3' // 数据
      },
      color: {
        type: Array,
        default: () => ['#489EF8', '#4771D8']
      }
    },
    data () {
      return {
        myChart: null,
        options: {
          title: {
            text: '30%',
            x: 'center',
            y: 'center',
            textStyle: {
              fontWeight: 'normal',
              color: 'white',
              fontSize: '12'
            }
          },
          tooltip: {
            show: false,
            trigger: 'item'
          },
          legend: {
            show: false,
            bottom: 10,
            itemWidth: 12,
            itemHeight: 12,
            itemGap: 30,
            textStyle: {
              color: '#405B84'
            }
          },
          grid: {
            left: '3%',
            right: '4%',
            bottom: '10%',
            containLabel: true
          },
          // color: ['#68A0F7', '#64DEF3', '#40CE66', '#F87F4C'],
          series: [
            {
              name: '总数',
              type: 'pie',
              label: {
                show: false,
                color: '#405B84',
                formatter: '{b}: {d}%'
              },
              data: [
                {
                  value: 335,
                  name: '完成率',
                  itemStyle: {
                    color: {
                      type: 'linear',
                      x: 0,
                      y: 0,
                      x2: 0,
                      y2: 1,
                      colorStops: [{
                        offset: 0,
                        color: '#489EF8'
                      }, {
                        offset: 1,
                        color: '#4771D8'
                      }]
                    }
                  }
                },
                {
                  value: 1,
                  name: '完成',
                  itemStyle: {
                    color: '#CCCCCC'
                  }
                }
              ],
              radius: ['60%', '80%']
            }
          ]
        }
      }
    },
    watch: {
      data (n, o) {
        if (n !== o) {
          this.initData()
        }
      }
    },
    mounted () {
      this.initData()
    },
    methods: {
      initData () {
        const _this = this
        // console.log(this.$echarts)
        this.$nextTick(() => {
          this.options.title.text = Number(this.data * 100).toFixed(2) + '%'
          this.options.series[0].data[0].value = Number(this.data)
          this.options.series[0].data[1].value = 1 - Number(this.data)
          this.options.series[0].data[0].itemStyle.color.colorStops[0].color = this.color[0]
          this.options.series[0].data[0].itemStyle.color.colorStops[1].color = this.color[1]
          this.myChart = this.$echarts.init(this.$refs[`echartsComponent${this.random}`])
          this.myChart.setOption(this.options)
          this.myChart.on('click', function (params) {
            _this.$emit('chartClick', params)
          })
        })
      },
      disposeCharts () {
        this.myChart.dispose()
      },
      resetData (data) {
        this.myChart.setOption(data)
      }

    }
  }
</script>

// 年龄分布
      initAgeChart () {
        const that = this
        const data = [
          {
            value: 335,
            name: '<20'
          },
          {
            value: 234,
            name: '20-30'
          },
          {
            value: 335,
            name: '30-40'
          },
          {
            value: 234,
            name: '40-50'
          },
          {
            value: 124,
            name: '50-60'
          }
        ]
        const option = {
          title: {
            text: '30%',
            x: 'center',
            y: 'center',
            textStyle: {
              fontWeight: 'normal',
              color: 'white',
              fontSize: '12'
            }
          },
          tooltip: {
            show: false,
            trigger: 'item'
          },
          legend: {
            orient: 'vertical',
            top: 5,
            left: 250,
            itemWidth: 8,
            itemHeight: 8,
            itemGap: 12,
            icon: 'circle',
            textStyle: {
              color: '#333',
              fontSize: 14,
              rich: {
                a: {
                  width: 60,
                  fontSize: 14
                }
              }
            },
            formatter: function (name) {
              const number = that.getPercentage(data, name)
              return "{a|" + name + "}" + number + "%"
            }
          },
          grid: {
            left: '3%',
            right: '4%',
            bottom: '10%',
            containLabel: true
          },
          color: ['#8932FF', '#8FC31F', '#FFAC2E', '#44E3FF', '#4F9AFF'],
          series: [
            {
              name: '地区分布',
              type: 'pie',
              label: {
                show: false,
                color: '#405B84',
                formatter: '{b}: {d}%'
              },
              data: data,
              radius: ['60%', '90%'],
              center: ['30%', '50%']
            }
          ]
        }
        this.$refs.ageChartRef.initData(option)
      },
      // 得到百分比
      getPercentage (data, name) {
        const target = data.find(item => item.name === name)
        let total = 0
        let percentage = 0
        data.forEach(item => {
          total += Number(item.value)
        })
        if (target) {
          percentage = (target.value / total).toFixed(2) * 100
        }
        return percentage
      }
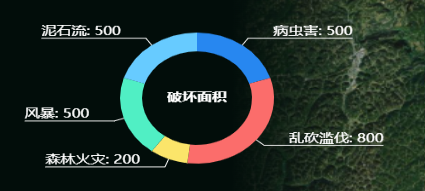
使用labelLayout 设置label流向两端,文字与标签的线对齐。title设置left:center设置饼图标题居中显示。
initChartZy() {
      const _this = this;
      this.chartZy = echarts.init(this.$refs["chartZy"]);
      console.log(this.chartZy);
      const data = [
        {
          value: 500,
          name: "病虫害",
        },
        {
          value: 800,
          name: "乱砍滥伐",
        },
        {
          value: 200,
          name: "森林火灾",
        },
        {
          value: 500,
          name: "风暴",
        },
        {
          value: 500,
          name: "泥石流",
        },
      ];
      const option = {
        title: {
          text: "破坏面积",
          left: "center",
          top: "center",
          textStyle: {
            color: "#fff",
            fontSize: 15,
          },
        },
        tooltip: {
          show: false,
          trigger: "item",
        },
        legend: {
          show: false,
          bottom: 10,
          itemWidth: 12,
          itemHeight: 12,
          itemGap: 30,
          textStyle: {
            color: "#405B84",
          },
        },
        color: ["#2787F0", "#FB6D6B", "#FBE56A", "#50EFC4", "#67CBFF"],
        series: [
          {
            name: "破坏面积",
            type: "pie",
            data: data,
            radius: ["50%", "70%"],
            center: ["50%", "50%"],
            label: {
              show: true,
              position: "outside",
              color: "#fff",
              fontSize: 15,
              formatter: "{b}: {c}",
            },
            labelLine: {
              show: true,
              length: 10, // 视觉引导线第一段的长度
              length2: 20, // 视觉引导项第二段的长度
              lineStyle: {
                width: 1,
                color: "#fff",
                type: "solid", // 线的类型
              },
            },
            labelLayout: function (params) {
              const isLeft = params.labelRect.x < _this.chartZy.getWidth() / 2;
              const points = params.labelLinePoints;
              // Update the end point.
              points[2][0] = isLeft
                ? params.labelRect.x
                : params.labelRect.x + params.labelRect.width;
              return {
                labelLinePoints: points,
                verticalAlign: "bottom",
              };
            },
            z: 2,
          },
        ],
      };
      this.chartZy.setOption(option);
    },

饼图3D效果。
initChart4() {
var myChart = echarts.init(document.getElementById("chartsContent"));
// 生成扇形的曲面参数方程,用于 series-surface.parametricEquation
function getParametricEquation(
startRatio,
endRatio,
isSelected,
isHovered
) {
// 计算
let midRatio = (startRatio + endRatio) / 2;
let startRadian = startRatio * Math.PI * 2;
let endRadian = endRatio * Math.PI * 2;
let midRadian = midRatio * Math.PI * 2;
// 如果只有一个扇形,则不实现选中效果。
if (startRatio === 0 && endRatio === 1) {
isSelected = false;
}
// 计算选中效果分别在 x 轴、y 轴方向上的位移(位移均为 0)
let offsetX = 0;
let offsetY = 0;
// 计算选中效果在 z 轴方向上的位移(未选中,位移均为 0)
let offsetZ = isSelected ? 0.15 : 0;
// 计算高亮效果的放大比例(未高亮,则比例为 1)
let hoverRate = isHovered ? 1.05 : 1;
let tmp = 0;
// 返回曲面参数方程
return {
u: {
min: 0,
max: Math.PI * 2,
step: Math.PI / 100,
},
v: {
min: 0,
max: Math.PI,
step: Math.PI / 50,
},
x: function (u, v) {
if (midRatio - 0.5 < 0) {
if (u < startRadian || u > midRadian + Math.PI) {
tmp =
u - Math.PI - midRadian < 0
? u + Math.PI - midRadian
: u - Math.PI - midRadian;
return (
offsetX +
((Math.sin(startRadian) * tmp) /
(Math.PI - midRadian + startRadian)) *
hoverRate
);
}
if (u > endRadian && u < midRadian + Math.PI) {
tmp = midRadian + Math.PI - u;
return (
offsetX +
((Math.sin(endRadian) * tmp) /
(Math.PI - midRadian + startRadian)) *
hoverRate
);
}
} else {
if (u < startRadian && u > midRadian - Math.PI) {
tmp = u + Math.PI - midRadian;
return (
offsetX +
((Math.sin(startRadian) * tmp) /
(Math.PI - midRadian + startRadian)) *
hoverRate
);
}
if (u > endRadian || u < midRadian - Math.PI) {
tmp =
midRadian - Math.PI - u < 0
? midRadian + Math.PI - u
: midRadian - Math.PI - u;
return (
offsetX +
((Math.sin(endRadian) * tmp) /
(Math.PI - midRadian + startRadian)) *
hoverRate
);
}
}
return offsetX + Math.sin(v) * Math.sin(u) * hoverRate;
},
y: function (u, v) {
if (midRatio - 0.5 < 0) {
if (u < startRadian || u > midRadian + Math.PI) {
tmp =
u - Math.PI - midRadian < 0
? u + Math.PI - midRadian
: u - Math.PI - midRadian;
return (
offsetY +
((Math.cos(startRadian) * tmp) /
(Math.PI - midRadian + startRadian)) *
hoverRate
);
}
if (u > endRadian && u < midRadian + Math.PI) {
tmp = midRadian + Math.PI - u;
return (
offsetY +
((Math.cos(endRadian) * tmp) /
(Math.PI - midRadian + startRadian)) *
hoverRate
);
}
} else {
if (u < startRadian && u > midRadian - Math.PI) {
tmp = u + Math.PI - midRadian;
return (
offsetY +
((Math.cos(startRadian) * tmp) /
(Math.PI - midRadian + startRadian)) *
hoverRate
);
}
if (u > endRadian || u < midRadian - Math.PI) {
tmp =
midRadian - Math.PI - u < 0
? midRadian + Math.PI - u
: midRadian - Math.PI - u;
return (
offsetY +
((Math.cos(endRadian) * tmp) /
(Math.PI - midRadian + startRadian)) *
hoverRate
);
}
}
return offsetY + Math.sin(v) * Math.cos(u) * hoverRate;
},
z: function (u, v) {
return offsetZ + (Math.cos(v) > 0 ? 0.1 : -0.1);
},
};
}
// 生成模拟 3D 饼图的配置项
function getPie3D(pieData) {
let series = [];
let sumValue = 0;
let startValue = 0;
let endValue = 0;
let legendData = [];
// 为每一个饼图数据,生成一个 series-surface 配置
for (let i = 0; i < pieData.length; i++) {
sumValue += pieData[i].value;
let seriesItem = {
name:
typeof pieData[i].name === "undefined"
? `series${i}`
: pieData[i].name,
type: "surface",
parametric: true,
wireframe: {
show: false,
},
pieData: pieData[i],
pieStatus: {
selected: false,
hovered: false,
},
};
if (typeof pieData[i].itemStyle != "undefined") {
let itemStyle = {};
if (typeof pieData[i].itemStyle.color != "undefined") {
itemStyle.color = pieData[i].itemStyle.color;
}
if (typeof pieData[i].itemStyle.opacity != "undefined") {
itemStyle.opacity = pieData[i].itemStyle.opacity;
}
seriesItem.itemStyle = itemStyle;
}
series.push(seriesItem);
}
// 使用上一次遍历时,计算出的数据和 sumValue,调用 getParametricEquation 函数,
// 向每个 series-surface 传入不同的参数方程 series-surface.parametricEquation,也就是实现每一个扇形。
for (let i = 0; i < series.length; i++) {
endValue = startValue + series[i].pieData.value;
series[i].pieData.startRatio = startValue / sumValue;
series[i].pieData.endRatio = endValue / sumValue;
series[i].parametricEquation = getParametricEquation(
series[i].pieData.startRatio,
series[i].pieData.endRatio,
false,
false
);
startValue = endValue;
legendData.push(series[i].name);
}
// 补充一个透明的圆环,用于支撑高亮功能的近似实现。
// series.push({
// type: "surface",
// parametric: true,
// wireframe: {
// show: false,
// },
// itemStyle: {
// opacity: 0,
// },
// parametricEquation: {
// u: {
// min: 0,
// max: Math.PI * 2,
// step: Math.PI / 20,
// },
// v: {
// min: 0,
// max: Math.PI,
// step: Math.PI / 20,
// },
// x: function (u, v) {
// return Math.sin(v) * Math.sin(u) + Math.sin(u);
// },
// y: function (u, v) {
// return Math.sin(v) * Math.cos(u) + Math.cos(u);
// },
// z: function (u, v) {
// return Math.cos(v) > 0 ? 0.1 : -0.1;
// },
// },
// });
// 准备待返回的配置项,把准备好的 legendData、series 传入。
let option = {
legend: {
// top: "bottom",
bottom: 5,
textStyle: {
color: "#fff",
},
},
xAxis3D: {
min: -1,
max: 1,
},
yAxis3D: {
min: -1,
max: 1,
},
zAxis3D: {
min: -1,
max: 1,
},
grid3D: {
show: false,
boxHeight: 150, // 厚度
top: -20,
left: 0,
boxWidth: 144,
viewControl: {
//3d效果可以放大、旋转等,请自己去查看官方配置
alpha: 53, // 角度
beta: 0, // 饼块开始位置角度
rotateSensitivity: 0,
zoomSensitivity: 0,
panSensitivity: 0,
autoRotate: false,
},
light: {
main: {
color: "rgb(85, 84, 84)", // 主光源的颜色。
shadow: true, // 主光源是否投射阴影
alpha: 80, // 主光源绕 x 轴,即上下旋转的角度
},
},
},
series: series,
};
return option;
}
// 监听鼠标事件,实现饼图选中效果(单选),近似实现高亮(放大)效果。
let selectedIndex = "";
let hoveredIndex = "";
// // 监听点击事件,实现选中效果(单选)
// myChart.on('click', function (params) {
// // 从 option.series 中读取重新渲染扇形所需的参数,将是否选中取反。
// let isSelected = !option.series[params.seriesIndex].pieStatus.selected;
// let isHovered = option.series[params.seriesIndex].pieStatus.hovered;
// let startRatio = option.series[params.seriesIndex].pieData.startRatio;
// let endRatio = option.series[params.seriesIndex].pieData.endRatio;
// // 如果之前选中过其他扇形,将其取消选中(对 option 更新)
// if (selectedIndex !== '' && selectedIndex !== params.seriesIndex) {
// option.series[selectedIndex].parametricEquation = getParametricEquation(option.series[selectedIndex].pieData.startRatio, option.series[selectedIndex].pieData.endRatio, false, false);
// option.series[selectedIndex].pieStatus.selected = false;
// }
// // 对当前点击的扇形,执行选中/取消选中操作(对 option 更新)
// option.series[params.seriesIndex].parametricEquation = getParametricEquation(startRatio, endRatio, isSelected, isHovered);
// option.series[params.seriesIndex].pieStatus.selected = isSelected;
// // 如果本次是选中操作,记录上次选中的扇形对应的系列号 seriesIndex
// isSelected ? selectedIndex = params.seriesIndex : null;
// console.log('option-click: ', option)
// // 使用更新后的 option,渲染图表
// myChart.setOption(option);
// });
// // 监听 mouseover,近似实现高亮(放大)效果
// myChart.on('mouseover', function (params) {
// // 准备重新渲染扇形所需的参数
// let isSelected;
// let isHovered;
// let startRatio;
// let endRatio;
// // 如果触发 mouseover 的扇形当前已高亮,则不做操作
// if (hoveredIndex === params.seriesIndex) {
// return;
// // 否则进行高亮及必要的取消高亮操作
// } else {
// // 如果当前有高亮的扇形,取消其高亮状态(对 option 更新)
// if (hoveredIndex !== '') {
// // 从 option.series 中读取重新渲染扇形所需的参数,将是否高亮设置为 false。
// isSelected = option.series[hoveredIndex].pieStatus.selected;
// isHovered = false;
// startRatio = option.series[hoveredIndex].pieData.startRatio;
// endRatio = option.series[hoveredIndex].pieData.endRatio;
// // 对当前点击的扇形,执行取消高亮操作(对 option 更新)
// option.series[hoveredIndex].parametricEquation = getParametricEquation(startRatio, endRatio, isSelected, isHovered);
// option.series[hoveredIndex].pieStatus.hovered = isHovered;
// // 将此前记录的上次选中的扇形对应的系列号 seriesIndex 清空
// hoveredIndex = '';
// }
// // 如果触发 mouseover 的扇形不是透明圆环,将其高亮(对 option 更新)
// if (params.seriesName !== 'mouseoutSeries') {
// // 从 option.series 中读取重新渲染扇形所需的参数,将是否高亮设置为 true。
// isSelected = option.series[params.seriesIndex].pieStatus.selected;
// isHovered = true;
// startRatio = option.series[params.seriesIndex].pieData.startRatio;
// endRatio = option.series[params.seriesIndex].pieData.endRatio;
// // 对当前点击的扇形,执行高亮操作(对 option 更新)
// option.series[params.seriesIndex].parametricEquation = getParametricEquation(startRatio, endRatio, isSelected, isHovered);
// option.series[params.seriesIndex].pieStatus.hovered = isHovered;
// // 记录上次高亮的扇形对应的系列号 seriesIndex
// hoveredIndex = params.seriesIndex;
// }
// // 使用更新后的 option,渲染图表
// myChart.setOption(option);
// }
// });
// // 修正取消高亮失败的 bug
// myChart.on('globalout', function () {
// if (hoveredIndex !== '') {
// // 从 option.series 中读取重新渲染扇形所需的参数,将是否高亮设置为 true。
// isSelected = option.series[hoveredIndex].pieStatus.selected;
// isHovered = false;
// startRatio = option.series[hoveredIndex].pieData.startRatio;
// endRatio = option.series[hoveredIndex].pieData.endRatio;
// // 对当前点击的扇形,执行取消高亮操作(对 option 更新)
// option.series[hoveredIndex].parametricEquation = getParametricEquation(startRatio, endRatio, isSelected, isHovered);
// option.series[hoveredIndex].pieStatus.hovered = isHovered;
// // 将此前记录的上次选中的扇形对应的系列号 seriesIndex 清空
// hoveredIndex = '';
// }
// // 使用更新后的 option,渲染图表
// myChart.setOption(option);
// });
const colorList = ["#0CADFE", "#03D7EC"];
const dataSource = [
{
name: "中央",
value: 25,
},
{
name: "地方",
value: 10,
},
];
const paramsList = dataSource.map((item, index) => {
return {
...item,
shading: "realistic",
itemStyle: {
color: colorList[index],
},
};
});
// 传入数据生成 option
let option = getPie3D(paramsList);
// 是否需要label指引线,如果要就添加一个透明的2d饼状图并调整角度使得labelLine和3d的饼状图对齐,并再次setOption
option.series.push({
name: "资金来源", //自己根据场景修改
type: "pie",
hoverAnimation: false, // 悬停不放大
// label: {
// normal: {
// show: true,
// formatter: function (params) {
// return `{${params.percent}%}\n{${params.name}}`
// }
// },
// },
label: {
opacity: 1,
position: "outside",
fontSize: 12,
lineHeight: 15,
textStyle: {
fontSize: 12,
color: "#fff",
},
formatter: function (params) {
console.log(params, "===============================");
// return `${params.name}投资金额\n${params.value}亿元\n(${params.percent})%`;
return `${params.name}投资 ${params.value}亿元`;
},
},
labelLine: {
show: true,
length: 10, // 视觉引导线第一段的长度
length2: 50, // 视觉引导项第二段的长度
lineStyle: {
width: 1,
color: "#fff",
type: "solid", // 线的类型
},
},
// label: {
// position: "bottom",
// formatter: function (params) {
// console.log(params,'-----------------------');
// return `{percentSty|${params.percent}%}\n{nameSty|${params.name}}`;
// },
// rich: {
// nameSty: {
// fontSize: 16,
// lineHeight: 22,
// fontFamily: "PingFangSC-Regular",
// fintWeight: 400,
// },
// percentSty: {
// fontSize: 14,
// lineHeight: 20,
// fontFamily: "PingFangSC-Regular",
// fintWeight: 400,
// color: '#FFFFFF',
// },
// countSty: {
// fontSize: 14,
// lineHeight: 20,
// fontFamily: "PingFangSC-Regular",
// fintWeight: 400,
// color: '#B9D3ED',
// padding: [0, 8, 0, 8],
// backgroundColor: 'rgb(90,156,241,0.3)',
// borderRadius: 2,
// },
// },
// },
// labelLine: {
// showAbove: false,
// length: 20, // 视觉引导线第一段的长度
// length2: 40, // 视觉引导项第二段的长度
// lineStyle: {
// color: "#686868", // 改变标示线的颜色
// width: 1,
// type: 'solid', // 线的类型
// },
// },
startAngle: 60, // 起始角度,支持范围[0, 360]。
clockwise: true, // 饼图的扇区是否是顺时针排布。上述这两项配置主要是为了对齐3d的样式
radius: ["40%", "52%"],
center: ["50%", "43%"],
data: paramsList,
itemStyle: {
opacity: 0, //这里必须是0,不然2d的图会覆盖在表面
},
});
myChart.setOption(option);
},


 2396
2396

 被折叠的 条评论
为什么被折叠?
被折叠的 条评论
为什么被折叠?
 到【灌水乐园】发言


