


目录
一些零碎
# -*- coding:utf-8 -*-- split字符串依据xx断开,读取txt以空格断开
str.split(str="", num=string.count(str)).

# str -- 分隔符,默认为所有的空字符,包括空格、换行(\n)、制表符(\t)等。
# num -- 分割次数。默认为 -1, 即分隔所有。
# 返回分割后的字符串列表。

eg: inTifs_split = inTifs.split(";")
    for i in range(len(inTifs_split)):
        arcpy.AddMessage(inTifs_split[i])
- 读取txt文件
# 读取文件以空格断开
CMA_File = open('txtfile','r')

# 第一种读法 readlines--for
lines = CMA_File.readlines()
for line in lines:
    Statistical_type = line.strip().split(",")  # strip用于删除换行符号"\n"
    line_ = [i for i in Statistical_type if i != '']  # 删除空格

# 第二种读法 readline--while
lines = CMA_File.readline()
while line:
    Statistical_type = line.split(",")[0]
line = line,readline- 调用当前python脚本目录
path = sys.path[0]- 当前文件夹下所有文件列表,路径+文件名
FilePath = r''
list_Files = os.listdir(FilePath)
for i in range(len(list_Files)):
File = os.path.join(FilePath,list_Files[i])- 枚举enumerate()
enumerate(sequence, [start=0])
参数:
sequence -- 一个序列、迭代器或其他支持迭代对象。
start -- 下标起始位置

eg:b = ['img_path1','img_path2','img_path3']
for i, img_path in enumerate(b,start=0):
    print i, element
>>>
0 img_path1
1 img_path2
2 img_path3

for i, img_path in enumerate(b,start=1):
    print i, element
>>>
1 img_path1
2 img_path2
3 img_path3- 删除列表中的空格
line_array = ['50136', '5258', '12231', '', '', '4385', '2015', '', '1', '', '1', '', '', '', '', '', '0', '', '', '', '', '', '0', '', '', '', '', '', '0', '0', '0', '0\n']

line_array = [x for x in line_array if x!='']

>>>['50136', '5258', '12231', '4385', '2015', '1', '1', '0', '0', '0', '0', '0', '0\n']
- if判断多条件:
if rainfall in ('32700','32XXX','31XXX','30XXX'):
print()- print 中的 %
print("该列数据的均值为%f,方差为%d" %(str1, str2))- 补零
# 原字符串左侧对齐, 右侧补零:
input: '789'.ljust(6,'0')
output: '789000'

# 原字符串右侧对齐, 左侧补零:
input: '789'.rjust(6,'0')
output: '000798'- 数据格式类型转换
# Numpy和list
List转Numpy:numpy.array(list)
Numpy转List:array.tolist()

# DataFrame和Numpy
Numpy转dataframe:df = pd.DataFrame(np)
dataframe转Numpy:df.values、df.as_matrix()、np.array(T)

# dataframe和list
datafram转list
X = data_all_copy.iloc[:,0:61]    #将0到61列数据赋值给X
X = X.values     #.values方法将dataframe转为numpy.ndarray
X.tolist()   #将X转为list
list转dataframe:data=DataFrame(c)
- 删除list中的元素
# ① 未知索引删除某元素
list.romove('3')

# ② 知道索引
del list[1]

# ③ 删除空值
new_list = [i for i in cpuDetail if i !='']- 生成一列都是nan的数组
import numpy as np

np.full([1,5], np.nan)
# Out: array([[nan, nan, nan, nan, nan]])
format
greeting = "Hello, my name is {} and I am {} years old."
formatted_greeting = greeting.format(name, age)-
pandas读写csv/excel
①文件读取(csv用逗号和回车做分割,不会有多个sheet)
from pandas import read_csv
read_csv(path, header=0, index_col=False)

import pandas as pd
PRE = pd.read_excel('path.xls',index_col=0)


header=0:第0行为标题。如果没有标题使用None,无标题时可与names定义列名。(header=None,names=[])
index_col=0:第0列为index。如果没有使用False
若读取时出现错误'utf-8' codec can't decode byte 0xb1 in position 2: invalid start byte
解决方式:添加encoding=‘ANSI’
read_csv(path, header=0, index_col=False, encoding='ANSI')②获取pandas的列名和索引
# 获取列名,此时类型为<class 'numpy.ndarray'>
df.columns.values
# 获取列名
df.index.values

# 转为list型
df_name = list(df)
df_name = df.columns.tolist()
③获取数据
# ①按index和列名获取
dataframe.loc[index, columnsname]/dataframe.loc[0, columnsname]

# ②按索引获取
dataframe.iloc[0,2]

# ③转为np后,按行列号获取
PRE_np = np.array(dataframe)
rainfall = PRE_np[i, j]

# ④获取某行或某列
df['a']    #取a列
df[['a','b']]    #取a、b列

#ix可以用数字索引,也可以用index和column索引
df.ix[0]#取第0行
df.ix[0:4]#取第0-3行
df.ix['one':'two']#取one、two行
df.ix[0:2, 0]#取第0、1行,第0列
df.ix[0:1, 'a']#取第0行,a列
df.ix[0:2, 0:2]#取第0、1行,第0、1列

#loc只能通过index和columns来取,不能用数字
df.loc['one':'two','a':'c']#one到two行,a到c列
df.loc['one':'two',['a','c']]#one到two行,ac列

#iloc只能用数字索引,不能用索引名
df.iloc[0:2,0:2]#0、1行,0、1列
df.iloc[[0,2],[1,2,3]]#第0、2行,1、2、3列

#iat取某个单值,只能数字索引
df.iat[1,1]#第1行,1列
#at取某个单值,只能index和columns索引
df.at['one','a']#one行,a列

按条件选取符合条件的行
t1.loc[t1['dmjzkj_tb'] > 0]
符合条件的个数
len(t1.loc[t1['dmjzkj_tb'] > 0])
④ 像pandas中添加数据(行、列)
import pandas as pd
# 添加列数据:根据index和列名添加(不管有无该列/行都可)
dataframe.loc[i, 'stationName'] = 0
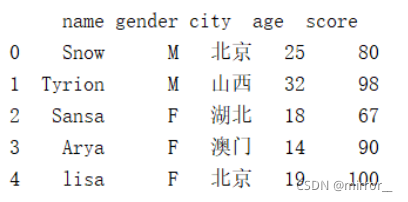
# 添加行数据:在最后新增一行 append
df1=df1.append(new,ignore_index=True) # ignore_index=True,表示不按原来的索引,从0开始自动递增
ptdk['kgzt'] = ptdk.apply(列数据, axis=1)
# 示例(未调试):
df = pd.DataFrame()
df1 = pd.DataFrame()
for i in range(10):
df.loc[0, 'name'] = value
df.loc[0, 'name1'] = value1
df1 = df1.append(df,ignore_index=True)
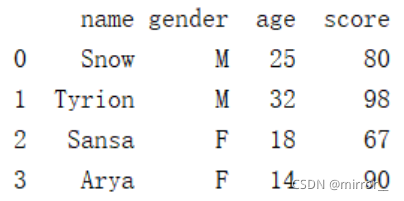
# 在最后加score列,元素值分别为:80,98,67,90
df1['score'] = [80,98,67,90]
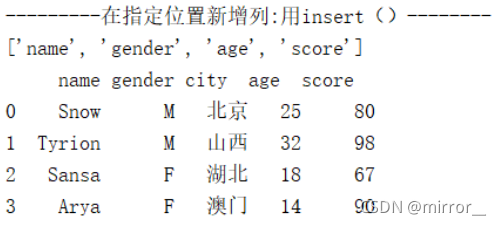
# 在中间增加列(列索引为2处插入列),刚插入时不会有值,整列都是NaN
col_name.insert(2,'city')
df1 = df1.reindex(columns=col_name) # 对原行/列索引重新构建索引值
df1['city'] = ['北京','山西','湖北','澳门']数据转换
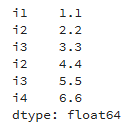
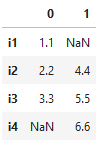
series转pandas:pd.DataFrame(s)
按表头选取新列
重命名列名
student_df_1.rename(columns={"id": "ID"}, inplace=True)
student_df_1.rename(
    columns={"ID": "Student_ID", "name": "First_Name", "grade": "Average_Grade"},
    inplace=True,)
③写入excel
import pandas as pd

dataframe = pd.DataFrame()

① 写入csv
dataframe.to_csv(path,header=None,index=False)

② 写入excel
df.to_excel('path',index=False)  # 无索引,有列名

③ 写入excel不同sheet
from openpyxl import load_workbook
excelWriter = pd.ExcelWriter('path.xlsx',engine='openpyxl'/xlsxwriter)
df1.to_excel(excelWriter,index=False,sheet_name='1')
df2.to_excel(excelWriter,index=False,sheet_name='2')
excelWriter.save()- 合并两个pandas(merge列、join行、concat)
concat() 有行拼接和列拼接,默认是行拼接和外拼接(并集),可以根据不同的轴做简单的融合
pd.concat(objs,axis=0,join='outer',join_axes=None,ignore_index=False,<br>keys=None,levels=None,verify_integrity=False)

objs:要合并的数据(series或者dataframe或者列表),传入形式为列表或者字典;
axis:默认为0,以行合并;为1时是以列合并。
join:默认为'outer',即取并集;join='inner'时为取交集。
keys:axis=0时keys为可以创建一个层次化索引;axis=1时keys会成为dataframe 的列索引名。

eg:  pd.concat([df1,df2])
行拼接: 列拼接:
-
简单画图plt
① 画单张图
import matplotlib.pyplot as plt
创建自定义图像
fig = plt.figure(figsize=(4,3),facecolor='blue')
plt.show()


figure(num=None, figsize=None, dpi=None, facecolor=None, edgecolor=None, frameon=True)
# num:图像编号或名称,数字为编号 ,字符串为名称
# figsize:指定figure的宽和高,单位为英寸;
# dpi参数指定绘图对象的分辨率,即每英寸多少个像素,缺省值为80      1英寸等于2.5cm,A4纸是 21*30cm的纸张
# facecolor:背景颜色
# edgecolor:边框颜色
# frameon:是否显示边框
② 画多张图
import matplotlib.pyplot as plt
plt.figure()
plt.subplot(2, 2, 1) #二行二列的左边第一个图像
plt.imshow(im_data) # 散点图可用plt.plot(x,y)
plt.subplot(2, 2, 2)
plt.imshow(img_new)
plt.show()


subplot(nrows,ncols,sharex,sharey,subplot_kw,**fig_kw)
# nrows subplot的行数
# ncols subplot的列数
-
GDAL读取grib并转tif
import os
import sys
from osgeo import gdal, osr, ogr
from gdalconst import *

import numpy as np

RootDir = " "
GribDir = RootDir+"grib\\"
tifDir = RootDir+"tif\\"

# 读取grib图像
for file in os.listdir(GribDir):
    filename = GribDir+file
    ds = gdal.Open(filename)
    gdal.AllRegister()

    if ds is None:
        print('Cannot open this .grb file.')
        sys.exit(1)

    cols = ds.RasterXSize  # 列数
    rows = ds.RasterYSize  # 行数
    bands = ds.RasterCount  # 波段数

    # 存放单波段grib数据
    # data = np.zeros((1, rows, cols), dtype=np.float64)
    # data = np.zeros((rows, cols), dtype=np.float64)# 存放数据的数组
    # data = ds.GetRasterBand(1).ReadAsArray(0, 0, cols, rows)

    # 存放多波段grib
    data = np.zeros((bands,rows, cols), dtype=np.float64)
    for i in range(bands):
        data[i] = ds.GetRasterBand(i+1).ReadAsArray(0, 0, cols, rows)


    # 写数据
    # 设置driver驱动为GTiff格式
    tifName = tifDir + file.split('.')[0]
    driver = gdal.GetDriverByName("GTiff").Create(tifName + '.tif', cols, rows, bands, gdal.GDT_Float64)
    geotransform = ds.GetGeoTransform()  #设置影像的显示范围
    driver.SetGeoTransform(geotransform)
    # 地理坐标系统信息
    srs = osr.SpatialReference()  # 获取地理坐标系统信息,用于选取需要的地理坐标系统
    srs.ImportFromEPSG(4326)  # 定义输出的坐标系为"WGS 84",AUTHORITY["EPSG","4326"]
    driver.SetProjection(srs.ExportToWkt())  # 给新建图层赋      c     予投影信息

    # 单波段数据写出
    # driver.GetRasterBand(1).WriteArray(data)  # 将数据写入内存,此时没有写入硬盘
    # band = driver.GetRasterBand(1)
    # nodata = 9999
    # band.SetNoDataValue(nodata)

    # 多波段数据写出
    for i in range(bands):
        driver.GetRasterBand(i+1).WriteArray(data[i])
        # 设置nodata值
        #set_nodata = driver.GetRasterBand(i+1)
        #nodata = 9999
        #set_nodata.SetNoDataValue(nodata)


    driver.FlushCache()  # 将数据写入硬盘
    del driver
print(tifName)-
GDAL读取tif(tif转png)
from osgeo import gdal, osr
import numpy as np
import pandas as pd
import matplotlib.pyplot as plt


img_name = 'p5-clip.tif'
tifFile = gdal.Open(img_name)
im_width = tifFile.RasterXSize   #347
im_height = tifFile.RasterYSize   #237
bands = tifFile.RasterCount


dt = tifFile.GetRasterBand(1)
im_data = dt.ReadAsArray(0,0,im_width,im_height)


geotrans = list(tifFile.GetGeoTransform())
print(tifFile.GetGeoTransform())
print(geotrans)
x_cell = geotrans[1]     # x分辨率
y_cell = geotrans[5]   # y分辨率

# [0][3]是左上坐标xy


 1090
1090

 被折叠的 条评论
为什么被折叠?
被折叠的 条评论
为什么被折叠?
 到【灌水乐园】发言


