 使用Vue.js绘制拓扑散点图


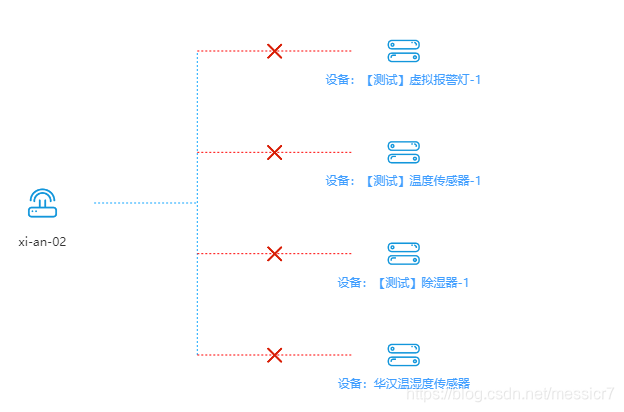
 本文介绍如何利用Vue.js实现拓扑图的绘制。在数据中没有指定位置的情况下,通过计算处理数据,区分单个设备和多个设备的情况,它们都隶属于同一个网关。内容包括HTML布局、数据处理和画图的步骤,最终展示清晰的拓扑散点图效果。
1.返回的数据
this.subDevice = [{
    "id": "873736ed2b860ad256f2e105d2fb2865",
    "name": "设备1",
    "online": 0
},
{
    "id": "663b4d95d94bc782fcd3a55b3bf119cc",
    "name": "设备2",
    "online": 0
},
{
    "id": "aaa3f9205d1850adb18ea763545855bf",
    "name": "设备3",
    "online": 0
}]
2.因为没有位置返回,所以需要自己计算,就是两种情况,一个返回设备,和多个返回设备,设备从属网关都是一个。
html及琐碎
<div :style="{ height: cellHeight, width: '100%' }" id="Topology"></div>

myChart: null,
chartData: {},
cellHeight: '300px',
getwayimg: "图片地址",
subdeviceimg: 图片地址",
closeimg: 图片地址"


this.cellHeight = document.body.offsetHeight - 300 + 'px'
数据处理画图
draw() {
this.chartData = [
{
type: 'scatter',
symbolSize: 35, //大小
zlevel: 20,
symbol: 'image://' + this.getwayimg, //图标
data: [
{
name: this.gateway.name, //名称
value: [0, 50] //位置
}
],
itemStyle: {
opacity: 1
},
label: {
show: true,
formatter: '{b}',
offset: [0, 40],
color: '#333333'
}
}
]
if (this.subDevice.length === 1) {
let tempLine = {
type: 'lines', // 连接线
coordinateSystem: 'cartesian2d',
zlevel: 1,
polyline: true,
lineStyle: {
width: 1,
type: 'dotted',
color:
this.subDevice[0].online !== 1
? '#ff0000'
: '#12A7FF',
opacity: 1
},
data: [
{
coords: [
[10, 50],
[50, 50]
]
}
]
}
let tempSymbol = {
type: 'scatter',
symbol: 'image://' + this.subdeviceimg,
symbolSize: 35,
zlevel: 20,
data: [
{
name: '设备:' + this.subDevice[0].name,
id: this.subDevice[0].id,
value: [60, 50]
}
],
itemStyle: {
opacity: 1
},
label: {
show: true,
formatter: '{b}',
offset: [0, 40],
color: '#409EFF'
}
}
if (this.subDevice[0].online !== 1) {
let close = {
type: 'scatter',
symbol: 'image://' + this.closeimg,
symbolSize: 25,
zlevel: 20,
data: [
{
name: '',
value: [30, 50]
}
],
itemStyle: {
opacity: 1
},
label: {
show: false
}
}
this.chartData.push(close)
}
this.chartData.push(tempSymbol)
this.chartData.push(tempLine)
} else if (this.subDevice.length > 1) {
let line = {
type: 'lines',
coordinateSystem: 'cartesian2d',
zlevel: 1,
polyline: true,
lineStyle: {
width: 1,
type: 'dotted',
color: '#12A7FF',
opacity: 1
},
itemStyle: {
opacity: 1
},
data: [
{
coords: [
[10, 50],
[30, 50]
]
},
{
coords: [
[30, 0],
[30, 100]
]
}
]
}
this.chartData.push(line)
for (let i = 0; i < this.subDevice.length; i++) {
let y = (100 / (this.subDevice.length - 1)) * i
let tempLine = {
type: 'lines',
coordinateSystem: 'cartesian2d',
zlevel: 1,
polyline: true,
lineStyle: {
width: 1,
type: 'dotted',
color:
this.subDevice[i].online !== 1
? '#ff0000'
: '#12A7FF',
opacity: 1
},
itemStyle: {
opacity: 1
},
data: [
{
coords: [
[30, y],
[60, y]
]
}
]
}
let tempSymbol = {
type: 'scatter',
symbol: 'image://' + this.subdeviceimg,
symbolSize: 35,
zlevel: 20,
data: [
{
name: '设备:' + this.subDevice[i].name,
id: this.subDevice[i].id,
value: [70, y]
}
],
itemStyle: {
opacity: 1
},
label: {
show: true,
formatter: '{b}',
offset: [0, 30],
color: '#409EFF'
}
}
if (this.subDevice[i].online !== 1) {
let close = {
type: 'scatter',
symbol: 'image://' + this.closeimg,
symbolSize: 25,
zlevel: 20,
data: [
{
name: '',
value: [45, y]
}
],
itemStyle: {
opacity: 1
},
label: {
show: false
}
}
this.chartData.push(close)
}
this.chartData.push(tempSymbol)
this.chartData.push(tempLine)
}
}
let chartId = document.getElementById('Topology')
this.myChart = echarts.init(chartId)
let option = {
xAxis: {
type: 'value',
min: 0,
max: 100,
splitLine: {
show: false
},
axisLine: {
show: false
},
axisTick: {
show: false
},
axisLabel: {
show: false
}
},
yAxis: {
type: 'value',
min: 0,
max: 100,
splitLine: {
show: false
},
axisLine: {
show: false
},
axisTick: {
show: false
},
axisLabel: {
show: false
}
},
series: this.chartData
}
this.myChart.setOption(option)
this.myChart.on('click', (params) => {
if (params.data.id) {
this.detail(params.data)
}
})
}效果图
为了清晰,写一下正常的数据结构
series: [{
        type: 'scatter',
        symbolSize: 35,
        zlevel: 20,
        data: [{
        name: '网关',
        value: [1, 60],
        }],
        itemStyle: {
        opacity: 1,
        },
        label: {
        show: true,
        formatter: '{b}',
        offset: [0, 40]
        }
    },
    {
      type: 'scatter',
      symbolSize: 35,
      data: [{
        name: '设备1',
        value: [30, 100],
      }, {
        name: '设备2',
        value: [30, 75],
      }, {
        name: '设备3',
        value: [30, 50],
      }, {
        name: '设备4',
        value: [30, 25],
      }
      ],
      itemStyle: {
        opacity: 1,
      },
      label: {
        show: true,
        position: 'inside',
        formatter: '{b}',
        offset: [0, 40]
      }
    },
    {
      type: 'lines',
      coordinateSystem: 'cartesian2d',
      zlevel: 1,
      polyline: true,
      lineStyle: {
        width: 2,
        type: 'dotted',
        color: '#12A7FF',
        opacity: 1
      },
      itemStyle: {
        opacity: 1
      },
      data: [
        {
          coords: [
            [15, 99],
            [25, 99]
          ],
        lineStyle: {
        width: 2,
        type: 'dotted',
        color: '#ff0000',
        opacity: 1}
        },
        {
          coords: [
            [15, 75],
            [25, 75]
          ]
        },
        {
          coords: [
            [15, 50],
            [25, 50]
          ]
        },
        {
          coords: [
            [15, 25],
            [25, 25]
          ]
        },
        {
          coords: [
            [15, 25],
            [15, 99],
          ]
        },
        {
          coords: [
            [5, 60],
            [15, 60],
          ]
        },
      ]
    }]


 899
899

 被折叠的 条评论
为什么被折叠?
被折叠的 条评论
为什么被折叠?
 到【灌水乐园】发言


