


 本文介绍了在Vue3中如何使用具名插槽,并结合Element UI的el-table组件进行自定义列表的实现。强调了查看官方文档对于深入学习的重要性,提供了具名插槽的写法示例以及插槽间传值的方法。
orz太久没更新了,应该会逐渐一口气补到day20左右
vue具名插槽(感悟到比起看别人的博客学习,还是更应该看官方文档,会学得更好些)
具名插槽写法
在一个 <BaseLayout> 组件中,有如下模板:
<div class="container">
  <header>
    <slot name="header"></slot>
  </header>
  <main>
    <slot></slot>
  </main>
  <footer>
    <slot name="footer"></slot>
  </footer>
</div>
在父组件中给对应的插槽传递内容
<BaseLayout>
  <template v-slot:header>
    <!-- header 插槽的内容放这里 -->
  </template>
</BaseLayout>
v-slot可以简写成#
#default会填入默认插槽中,即<slot></slot>中
<BaseLayout>
  <template #header>
    <h1>Here might be a page title</h1>
  </template>

  <template #default>
    <p>A paragraph for the main content.</p>
    <p>And another one.</p>
  </template>

  <template #footer>
    <p>Here's some contact info</p>
  </template>
</BaseLayout>
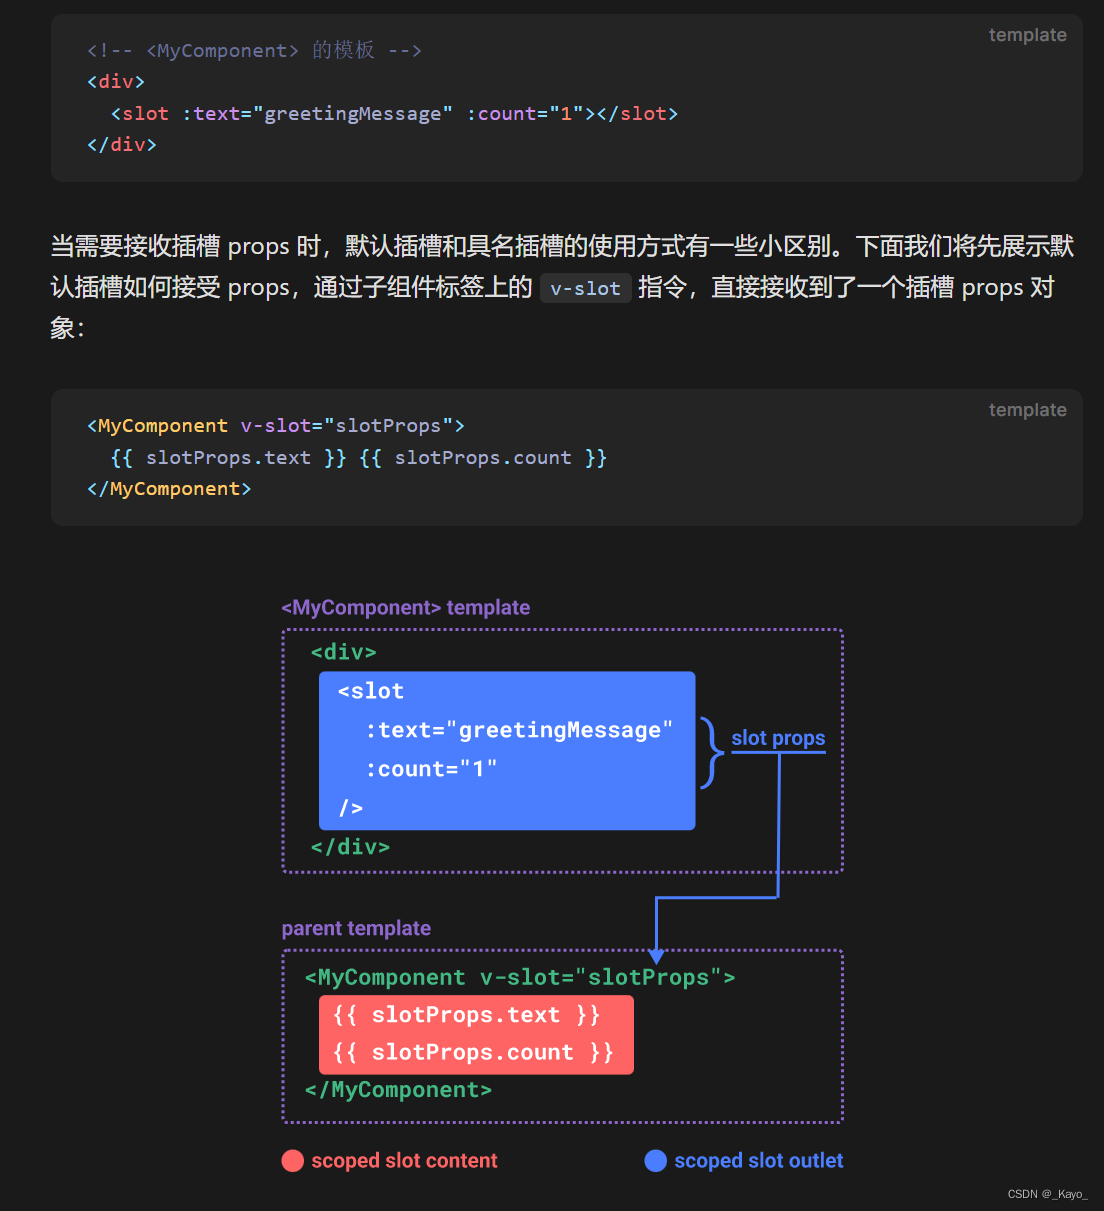
插槽间传值-默认插槽传值
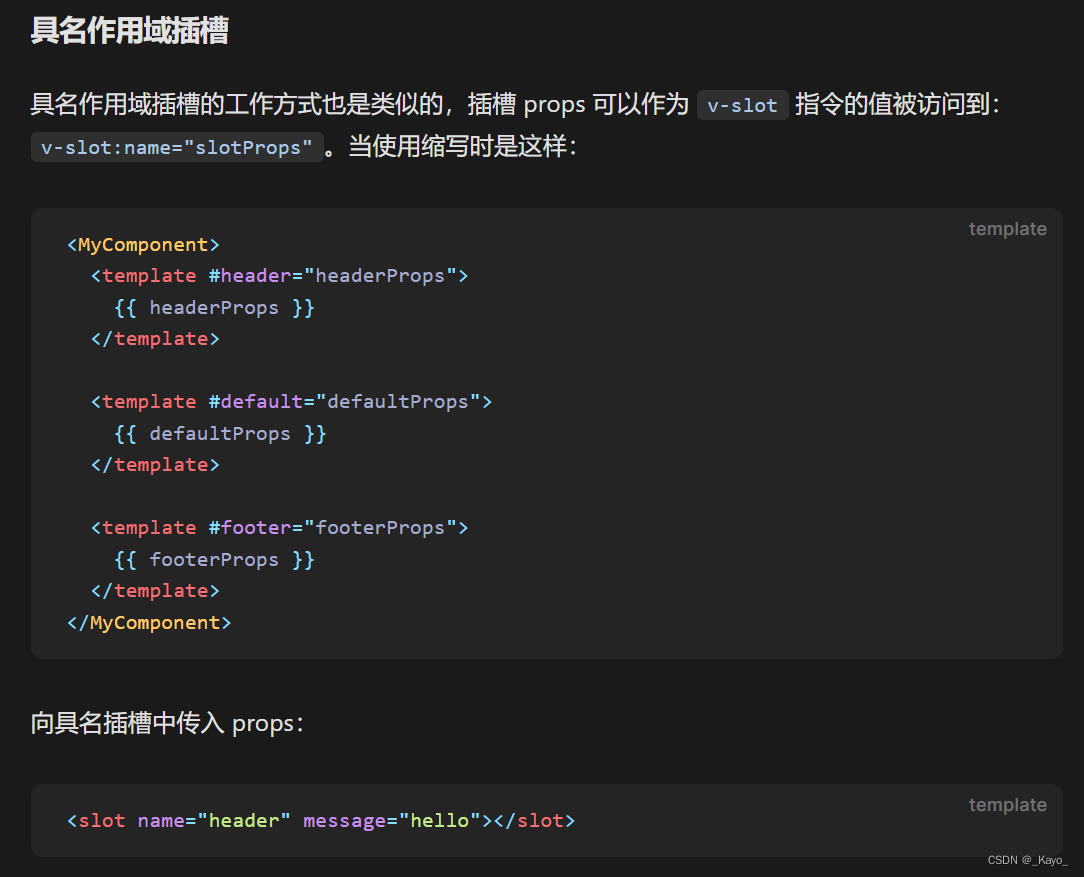
具名插槽传值
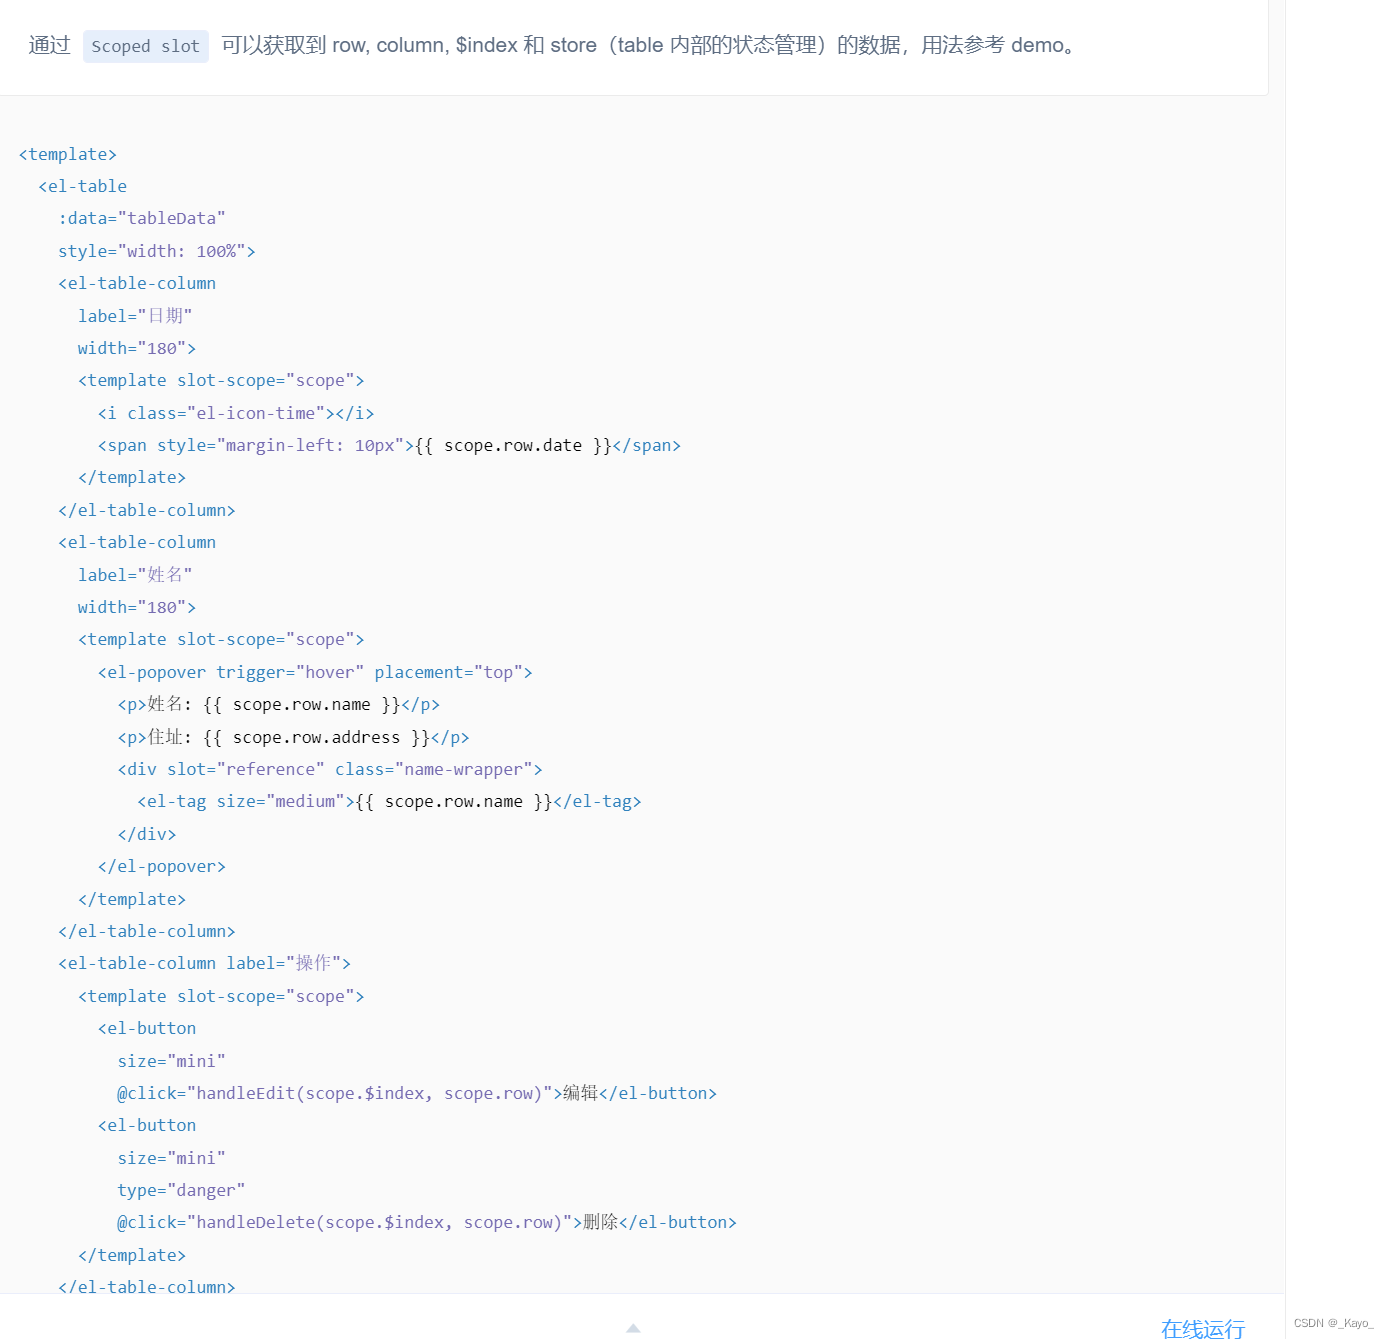
结合element-ui自定义列表
Element - The world's most popular Vue UI framework


 851
851

 被折叠的 条评论
为什么被折叠?
被折叠的 条评论
为什么被折叠?
 到【灌水乐园】发言


