


 本文通过天池数据集研究了11月至12月淘宝用户的行为,包括pv、uv、销售量、用户活跃度,以及top10购买量大的品类。还构建了12月用户从点击到支付的转化漏斗图,展示了数据清洗和关键业务洞察。
数据来自天池数据集,淘宝2004年11月18日至12月18日用户行为数据,本文导入446000条数据到本地mysql用于分析。 数据下载地址: https://tianchi.aliyun.com/dataset/dataDetail?dataId=46
数据包括字段为user_id、item_id、behavior_type(1–点击,2–收藏,3–加购物车,4–支付)、user_geohash、item_category、time。数据示例如下: 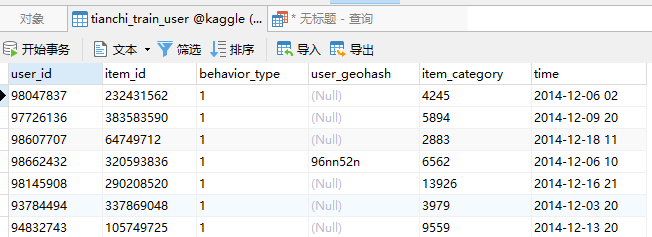
读取mysql数据
载入相关的库:
    import pymysql
    import pandas as pd
    from pyecharts import Line,Funnel
python3用pymysql连接mysql数据库,将数据读入pandas。
    conn = pymysql.connect(host='localhost',user='root',passwd='',db='kaggle')
    sql='select * from tianchi_train_user'
    df = pd.read_sql(sql,conn)
提出问题
本文要分析的问题有:
-
购物整体购物情况 月pv、月uv、月销售量、日均访问量、有购买行为的用户
-
购买量大的10个category
-
12月点击到支付的转化漏斗
数据清洗
-
behavior_type中分别用click、fav、cart、buy代替1、2、3、4。
-
将time字段分割成date、hour两个字段,并把date中字符串转化为日期、设成索引。
    df['behavior_type'].replace('1','click',inplace=True)
    df['behavior_type'].replace('2','fav',inplace=True)
    df['behavior_type'].replace('3','cart',inplace=True)
    df['behavior_type'].replace('4','buy',inplace=True)
    df['date'],df['hour']=df['time'].str.split(' ',1).str
    df['date'] = pd.to_datetime(df['date'])
    df = df.set_index('date',drop=True)
总体运营指标
-
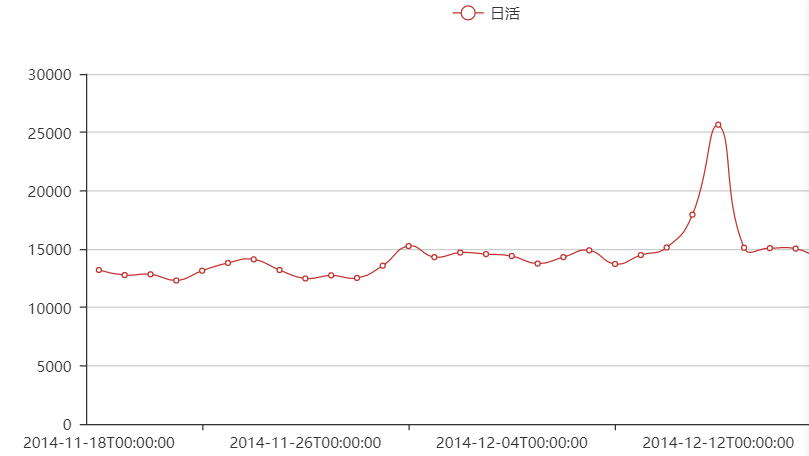
月pv、月uv、日活dau、月销售量、每个月有购买行为的用户数,利用pyecharts对日活可视化。
    # 月pv 11月162005 12月258053
    pv_month = df[df['behavior_type']=='click'].resample('M').count()['user_id']
    # 月uv 11月3398 12月3573
    uv_month = df.resample('M')['user_id'].nunique()
    # 月销售量 11月1630,12月2792
    sale_month = df[df['behavior_type']=='buy'].resample('M').count()['user_id']
    # 月购买行为的用户数 11月960,12月1441
    sale_user_m = df[df['behavior_type']=='buy'].resample('M')['user_id'].nunique()
    # 日活
    dau = df.groupby('date').count()['user_id']
    # 日活可视化
    line=Line()
    line.add('日活',list(dau.keys()),dau.values,is_smooth=True)
    line.render()
购买量大的10个category
pro_cate = df[df['behavior_type']=='buy'].groupby('item_category')['user_id'].count().sort_values(ascending=False).head(10)
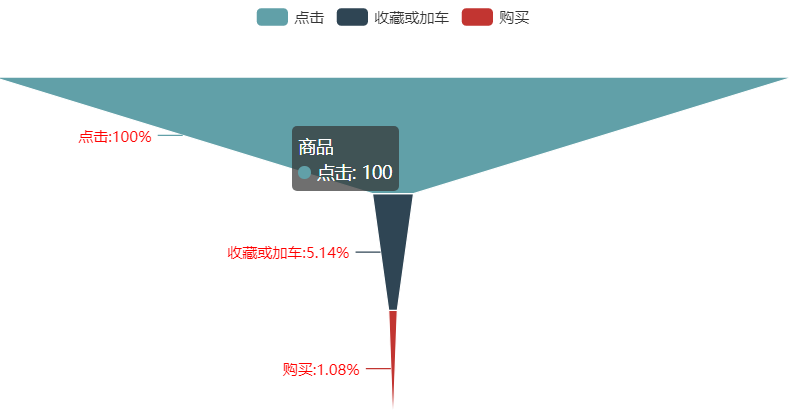
12月用户购买转化漏斗
购买、支付之前算过,现在算收藏或加车,pyecharts实现漏斗图。
    # 收藏或加车 12月fav 5408 加车 7844
    fav_month = df[df['behavior_type']=='fav'].resample('M').count()['user_id']
    cart_month = df[df['behavior_type']=='cart'].resample('M').count()['user_id']
    # 漏斗图
    attr = ["购买", "收藏或加车", "点击"]
    value = [round(2792.0*100/258053,2),round((7844.0+5408.0)*100/258053,2),1.0*100]
    funnel = Funnel("转化")
    funnel.add(
        "商品",
        attr,
        value,
        is_label_show=True,
        label_pos="left",
        label_formatter = '{b}:{c}%',
        label_text_color="#ff0000",
    )
    funnel.render()


 9575
9575

 被折叠的 条评论
为什么被折叠?
被折叠的 条评论
为什么被折叠?
 到【灌水乐园】发言


