


OpenLayers实现科技感网络连线效果
1.准点网络连线的点数据
推荐: https://github.com/dr5hn/countries-states-cities-database 。
该链接以 CSV 格式提供的城市国家/地区完整数据库。所有国家、州和城市都覆盖和填充了不同的组合和版本。
2.数据处理
- 对于点数据需要将其连城一条线进行展示,在这选择生成随机的二阶贝塞尔曲线,以达到美观的效果。
package org.zsh.utils;


public class BezierUtil {
    /**自动生成控制点(中点上方偏移)
     * 19332,Beijing,2257,BJ,Beijing,45,CN,China,39.90750000,116.39723000,Q956
     * @param p0
     * @param p1
     * @param curvature 0.2
     * @return
     */
    public static double[] getAutoControlPoint(double [] p0,double [] p1 ,double curvature){
        double x_ = (p0[0]+p1[0])/2;
        double y_ = (p0[1]+p1[1])/2;

        double dx = p1[0]-p0[0];
        double dy = p1[1]-p0[1];
        double len = Math.sqrt(dx*dx+dy*dy);
//        double perp_x = (Math.random() * 2 - 1)*dy/len;
        double perp_x = -dy/len;
        double perp_y = (Math.random() * 2 - 1)*dx/len;
        return new double[]{x_+perp_x*len*curvature,y_+perp_y*len*curvature};
    }
    public static double[] getAutoControlPoint(double [] p0,double [] p1){
        return getAutoControlPoint(p0,p1,Math.random() * 0.5);
    }

    /**
     * @param num 20
     * @param point1 起始点
     * @param point2 控制点
     * @param point3 结束点
     * */
    public static double[][] toBezierPoints(int num,double[] point1,double[] point2,double[] point3){
        double [][] pointList = new double[num][2];
        double x1 = point1[0], y1 = point1[1];
        double x2 = point3[0], y2 = point3[1];
        double cx = point2[0], cy = point2[1];

        for (int i = 0; i < num; i++) {
            double t = (num == 1) ? 1.0 : (double) i / (num - 1); // 确保 t ∈ [0, 1]
            double x = Math.pow(1 - t, 2) * x1 + 2 * t * (1 - t) * cx + Math.pow(t, 2) * x2;
            double y = Math.pow(1 - t, 2) * y1 + 2 * t * (1 - t) * cy + Math.pow(t, 2) * y2;
            pointList[i] = new double[]{x, y};
        }
        return pointList;
    }
    public static double[][] toBezierPoints(double[] point1,double[] point2,double[] point3){
        return toBezierPoints(20,point1,point2,point3);
    }
}
3. 数据发布
1.对于处理完成的数据需要转换成可以进行交互的WKT格式进行服务的发布。
private static GeometryFactory gf = new GeometryFactory();

    public static String toWktString(double[][] points){
        //createLineString(Coordinate[] coordinates)
        Coordinate [] po_s = new Coordinate[points.length];
        for (int i = 0; i < points.length; i++) {
            po_s[i] = new Coordinate(points[i][0],points[i][1]);
        }
        LineString ls = gf.createLineString(po_s);
        return ls.toText();
    }

// API
@GetMapping("/line")
    public void func1(ServletOutputStream os){
        long start = System.currentTimeMillis();
        String p = "src/main/resources/cities.csv";
        CityListener cl = new CityListener();

        EasyExcel.read(new File(p), CityEntity.class,cl).sheet().doRead();
        List<double[]> data = cl.data;

        double [] p1 = {116.39723000,39.90750000};
        //转换
        List<double[][]> var = data.parallelStream().map(e -> BezierUtil.toBezierPoints(p1, BezierUtil.getAutoControlPoint(p1, e), e)).collect(Collectors.toList());
        List<String> c = var.parallelStream().map(WktUtil::toWktString).collect(Collectors.toList());
        long end =System.currentTimeMillis();
        System.out.println("花费时间:"+(end-start));
        try{
            for (String s :c){
                os.write(s.getBytes(StandardCharsets.UTF_8));
                os.flush();
            }
            os.write("##END##".getBytes(StandardCharsets.UTF_8));
            os.flush();
            os.close();
        } catch (IOException e) {
            throw new RuntimeException(e);
        }
    }
- 因处理时大部分都为计算的操作,所以可以选择使用parallelStream并行流进行计算,可以加快大约20%的速度。(亲测)
4.openlayers部分
const draw_line_pic = ()=>{
        const line_pic = new VectorLayer({
            source:line_source ,
            style:new Style({
                    renderer: (pixelCoordinates,state)=>{
                        const ctx = state.context;
                        const length = pixelCoordinates.length;
                        // console.log(state)
                        const gradient = ctx.createLinearGradient(
                            pixelCoordinates[0][0],
                            pixelCoordinates[0][1],
                            pixelCoordinates[length - 1][0],
                            pixelCoordinates[length - 1][1]
                        );
                        //蓝紫色
                        // gradient.addColorStop(0, '#0000FF');
                        // gradient.addColorStop(0.5, '#8A2BE2');
                        // gradient.addColorStop(1, '#800080');
                        //银蓝色
                        gradient.addColorStop(0, '#C0C0C0');
                        gradient.addColorStop(0.3, '#6495ED');
                        gradient.addColorStop(1, '#00008B');
                        ctx.beginPath();
                        ctx.moveTo(pixelCoordinates[0][0], pixelCoordinates[0][1]);
                        for (let i = 1; i < length; i++) {
                            ctx.lineTo(pixelCoordinates[i][0], pixelCoordinates[i][1]);
                        }
                        ctx.strokeStyle = gradient;
                        ctx.lineWidth = 1;
                        ctx.stroke();
                    }
            })
        })
        map.addLayer(line_pic)
    }

    let line_source = new Vector({
                features: []
            })

    async function fetchData(url) {
        const headers = new Headers({
        });
        const response = await fetch(url,{headers});
        const reader = response.body.getReader();
        const decoder = new TextDecoder();

        let receivedData = '';
        let i = 0
        while (true) {
            const { done, value } = await reader.read();
            if (done){
                console.log('done');
                break;
            }

            receivedData = decoder.decode(value, { stream: true });
            try {
                let wk = format.readFeature(receivedData, {
                    dataProjection: 'EPSG:4326', // 目标坐标系
                    featureProjection: 'EPSG:3857' // 当前坐标系
                });
                line_source.addFeature(wk);
            } catch (error) {
                console.error('Error processing feature:', error);
            }
            console.log(i++)
            const endIndex = receivedData.indexOf('##END##'); // 查找自定义结束标识的位置
            if (endIndex!= -1) {
                const jsonData = receivedData.slice(0, endIndex); // 截取到结束标识之前的数据作为JSON数组内容
                receivedData = ''
            }
        }
    }
最后在onMounted内调用draw_line_pic即可,主要是采用了Style的renderer函数进行自定义渲染。
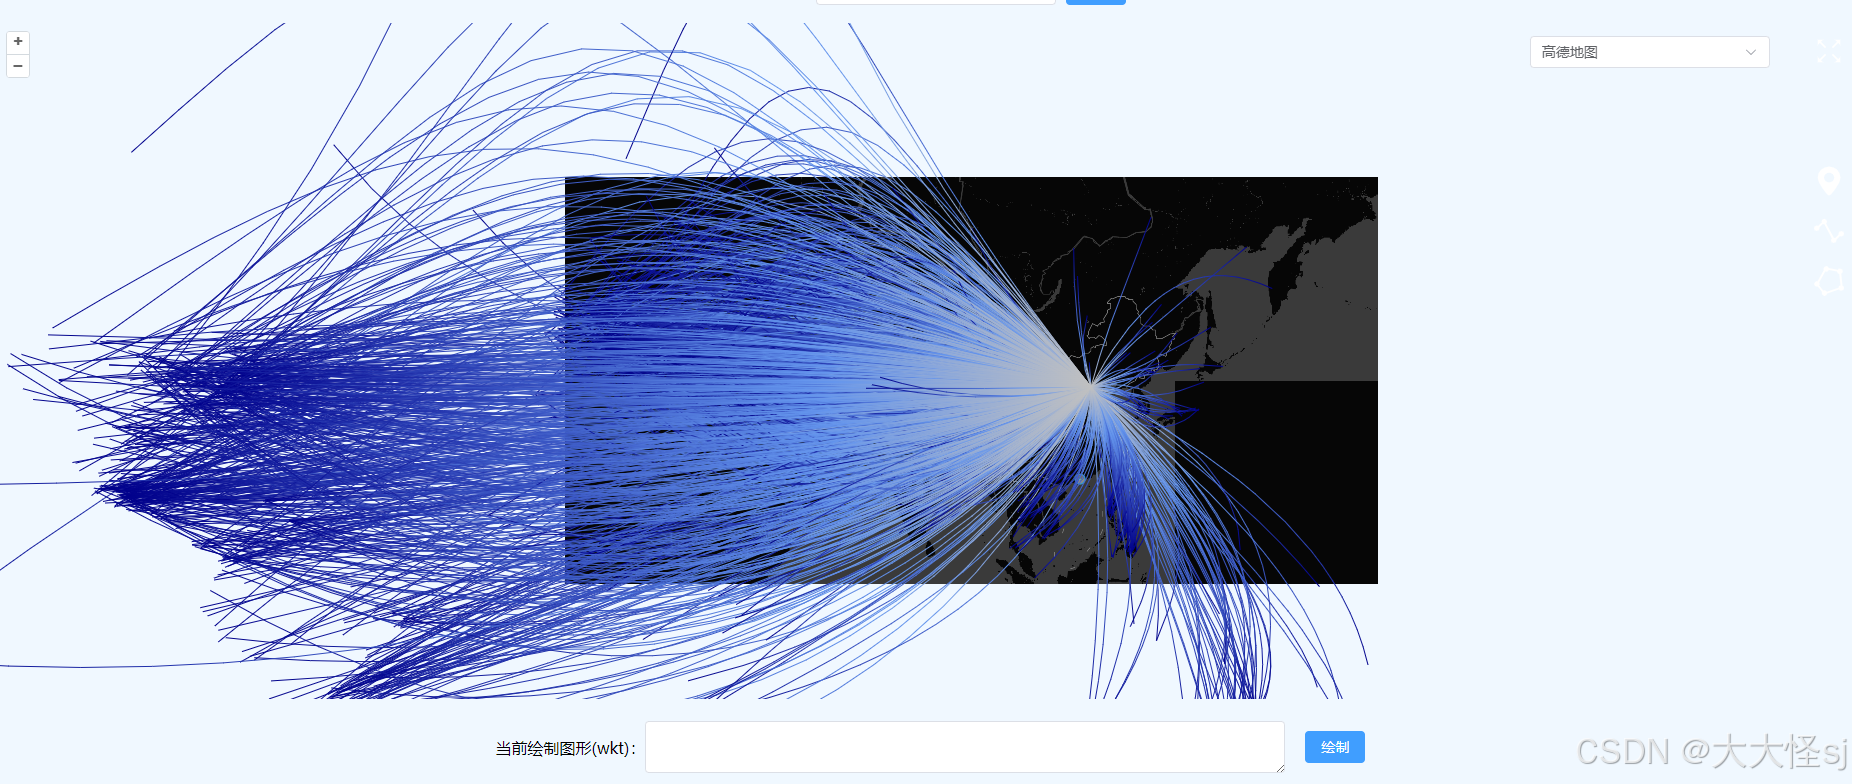
5.效果图


 被折叠的 条评论
为什么被折叠?
被折叠的 条评论
为什么被折叠?
 到【灌水乐园】发言


