


 本文介绍了在Vue项目中使用ECharts饼图如何在鼠标移动时动态显示数据。通过设置ECharts的title属性在图表中央显示标题,并利用鼠标移动事件获取饼图项的值,更新title内容,从而实现数据切换显示的效果。
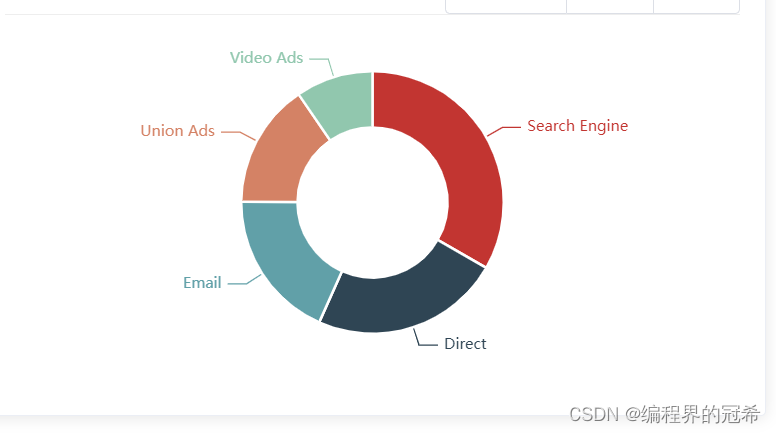
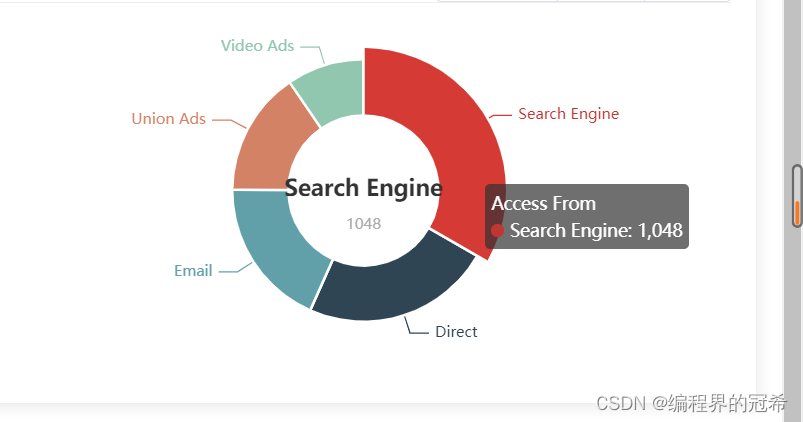
首先饼图的案例如下:
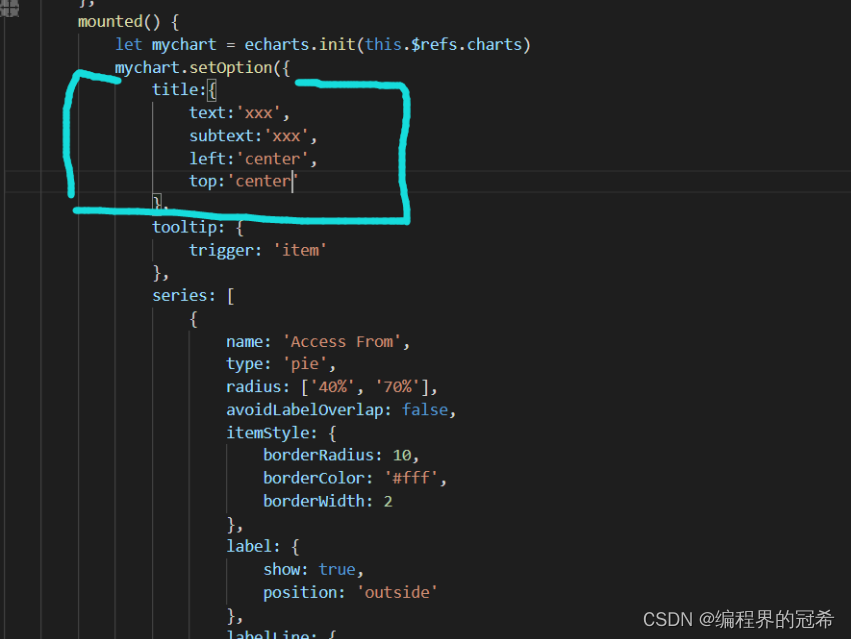
我们可以通过设置标题title然后设置title的位置再饼图的中央显示:
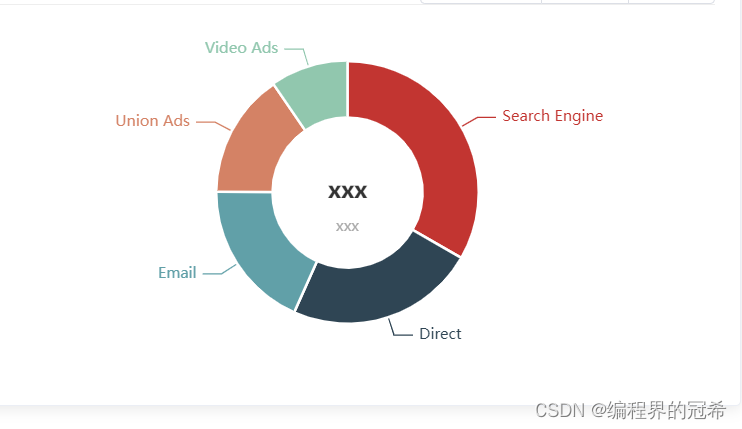
 效果如下:
效果如下:
接下来我们可以通过echarts中的鼠标移动事件来获取设置title中text的值
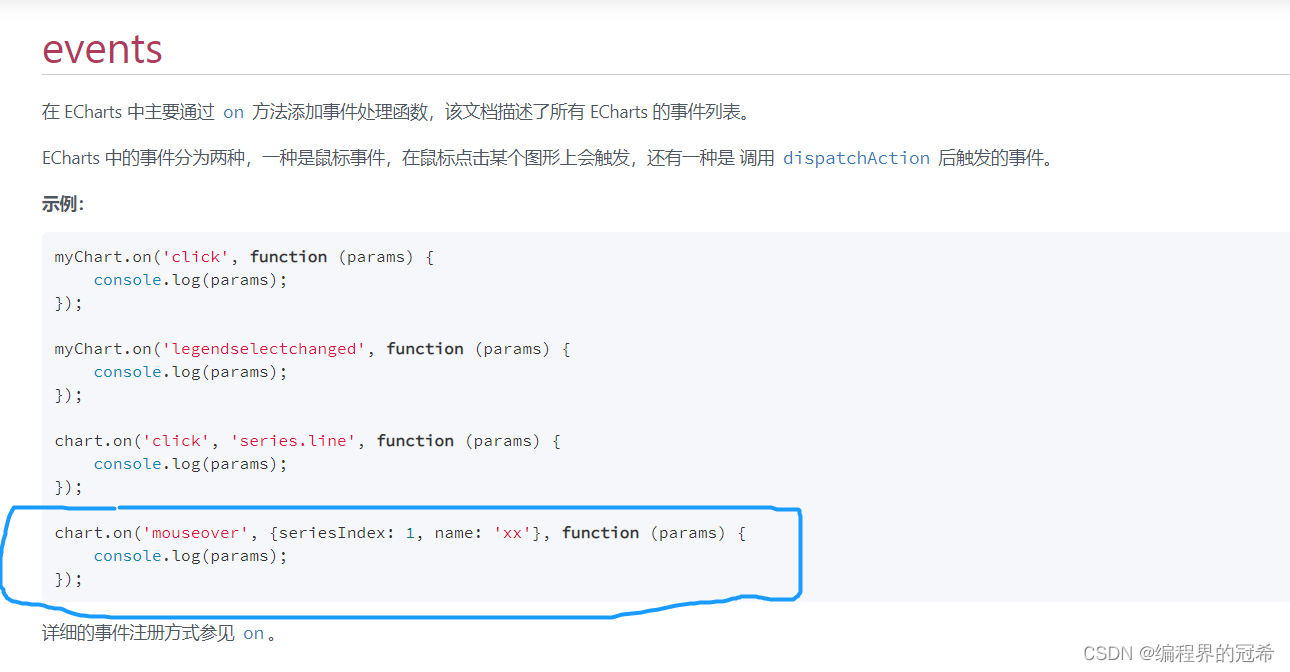
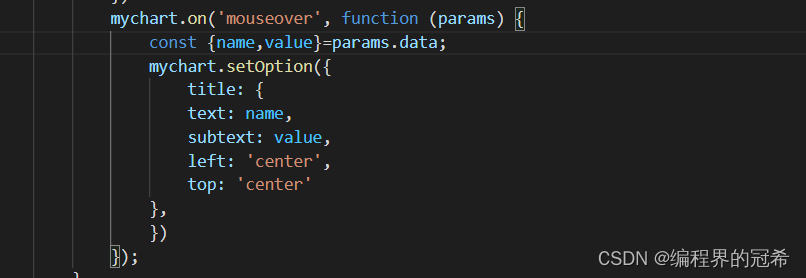
我们对刚刚refs获取到的echarts实例绑定鼠标移动事件,这是我们获取到的params的值就是鼠标移动到饼图上对应项的值。然后我们通过出需要展示的值通过setOption重新设置标题。
最终效果如下:
下面我把代码贴在此处 大家可以在vue中体验使用 (记得要引入echarts)
        <!-- html部分代码 -->
            <div class="charts" ref="charts">

            </div>
//script中的代码
 mounted() {
            let mychart = echarts.init(this.$refs.charts)
            mychart.setOption({
                tooltip: {
                    trigger: 'item'
                },
                series: [
                    {
                        name: 'Access From',
                        type: 'pie',
                        radius: ['40%', '70%'],
                        avoidLabelOverlap: false,
                        itemStyle: {
                            borderRadius: 10,
                            borderColor: '#fff',
                            borderWidth: 2
                        },
                        label: {
                            show: true,
                            position: 'outside'
                        },
                        labelLine: {
                            show: true
                        },
                        data: [
                            { value: 1048, name: 'Search Engine' },
                            { value: 735, name: 'Direct' },
                            { value: 580, name: 'Email' },
                            { value: 484, name: 'Union Ads' },
                            { value: 300, name: 'Video Ads' }
                        ]
                    }
                ]
            })
            mychart.on('mouseover', function (params) {
                const {name,value}=params.data;
                mychart.setOption({
                    title: {
                    text: name,
                    subtext: value,
                    left: 'center',
                    top: 'center'
                },
                })
            });
        },


 被折叠的 条评论
为什么被折叠?
被折叠的 条评论
为什么被折叠?
 到【灌水乐园】发言


