


 本文介绍了如何使用Echarts实现柱状图和趋势图之间的切换,详细展示了从父界面到子界面的交互过程,以及具体的效果展示。
1.实现效果

目录

父界面
<template>
  <div>
    <div class="leftBoxs">
      <div class="throw flex">
        <div class="throw-r sixth flex">
          <div class="throw-r-item querter">
            <i class="iconfont icon-kehuishou blueColor"></i>
            <div class="throwChart">
              <Circles :color="blue"></Circles>
            </div>
            <p class="classificationnum">12.12 t</p>
            <p class="blueColor classificationname">可回收垃圾</p>
            <p class="blueColor classificationnameen">Recyclable</p>
          </div>
          <div class="throw-r-item querter">
            <i class="iconfont icon-chuyu greenColor"></i>
            <div class="throwChart">
              <Circles :color="green"></Circles>
            </div>
            <p class="classificationnum">34.31 t</p>
            <p class="greenColor classificationname">厨余垃圾</p>
            <p class="greenColor classificationnameen">Food waste</p>
          </div>
          <div class="throw-r-item querter">
            <i class="iconfont icon-youhai redColor"></i>
            <div class="throwChart">
              <Circles :color="red"></Circles>
            </div>
            <p class="classificationnum">0.02 t</p>
            <p class="redColor classificationname">有害垃圾</p>
            <p class="redColor classificationnameen">Hazardous waste</p>
          </div>
          <div class="throw-r-item querter">
            <i class="iconfont icon-kehuishou yellowColor"></i>
            <div class="throwChart">
              <Circles :color="yellow"></Circles>
            </div>
            <p class="classificationnum">12.12 t</p>
            <p class="yellowColor classificationname">其他垃圾</p>
            <p class="yellowColor classificationnameen">Other waste</p>
          </div>
        </div>
      </div>
    </div>

  </div>
</template>
<script>
import Circles from "@/components/echarts/circle";
export default {
  components: {
    Circles,
  },
  data() {
    return {
      blue: "#27A1FF",
      green: "#16FFB3",
      red: "#E83C33",
      yellow: "#FFA02F",
    }
  },
};
</script>
<style lang="scss">


.throw {
  padding-top: 30px;

  .throw-l {
    .throw-l-l {
      img {
        width: 164px;
        height: 244px;
      }
    }

    .throw-l-r {
      width: calc(100% - 204px);
      margin-left: 40px;

      .todaytf {
        font-size: $pxthirtytwo;
        color: $colorwhite;
        font-weight: bold;
      }

      .todaytfALL {
        font-size: $pxsixty;
        color: $colorwhite;
        font-weight: bold;
        margin: 28px 0 7px;
        padding-bottom: 7px;
        border-bottom: 2px solid $colorsys;

        span {
          margin-left: 23px;
          font-size: $pxtwentyfour;
          color: $colorsys;
          font-weight: normal;
        }
      }

      .todaytfbili {
        font-size: $pxthirtytwo;
        color: $colorsys;
        margin-bottom: 8px;
      }

      .todaytftag {
        font-size: $pxtwentyfour;
        color: $colorsys;
        font-weight: 500;
      }
    }
  }

  .throw-r {
    .throw-r-item {
      text-align: center;

      .iconfont {
        font-size: $pxthirty;
      }

      .classificationnum {
        font-size: $pxtwentyfour;
        color: $colorwhite;
        font-weight: bold;
        text-align: center;
      }

      .classificationname {
        font-size: $pxtwentyfour;
        font-weight: bold;
        text-align: center;
      }

      .classificationnameen {
        font-size: $pxtwelve;
        text-align: center;
      }

      .throwChart {
        height: 12vh;
      }
    }
  }
}


</style>


</style>
子界面
<template>
  <div class="circle" ref="circle"></div>
</template>
<script>
export default {
  props: {
    data:Object,
    color:String,
  },
  data() {
    return {};
  },

  mounted() {
    this.$nextTick(() => {
      this.drawLine();
    });
  },
  watch: {
    data: function (newVal, oldVal) {
      this.$nextTick(() => {
        this.drawLine();
      });
    },
  },

  methods: {
    drawLine() {
      let myChart = this.$echarts.init(this.$refs.circle);
      var percent = 30;
      var option = {
          series: [
              {
                  type: 'pie',
                  radius: ['79%', '80%'],
                  label: {
                      normal: {
                          show: false
                      }
                  },
                  data: [{
                      name: '',
                      value: 100,
                      itemStyle: {
                          normal: {
                              color: '#fff',
                              shadowBlur:1,
                              shadowColor: '#3da1ee'
                          }
                      }
                  }],
                  zlevel: 1
              },
              {
                  name: 'main',
                  type: 'pie',
                  radius: ['76%', '82%'],
                  data: [
                      {
                          name: '完成率',
                          value: percent,
                          label: {
                              show: true,
                              position: 'center',
                              fontSize: 30,
                              formatter: '{d}%'
                          },
                          labelLine: {show: false},
                          itemStyle: {
                              normal: {
                                  color: this.color,
                                  shadowBlur: 3,
                                  shadowColor: '#f2c967'
                              }
                          }
                      },
                      {
                          value: 100 - percent,
                          itemStyle: {
                              normal: {
                                  color: 'transparent'
                              }
                          }
                      }
                  ],
                  zlevel: 2
              }
          ]
      };
      myChart.setOption(option);
      window.addEventListener("resize", function () {
        myChart.resize();
      });

    },
  },
};
</script>
<style lang="scss" scoped>
.circle {
  width: 100%;
  height: 100%;
}
</style>
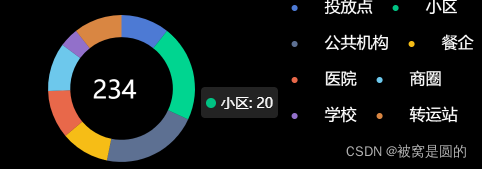
实现效果
目录
父界面
<template>
<div>
<div class="mainPart-l fifth">
<div class="mainPartChart">
<Circless></Circless>
</div>
</div>
</div>
</template>
<script>
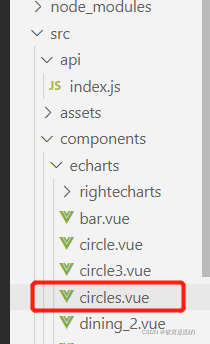
import Circless from "@/components/echarts/circles";
export default {
components: {
Circless,
},
data() {
return {
}
},
};
</script>
<style lang="scss">
.mainPart-l {
background-color: #000;
.mainPartChart {
height:25vh;
}
}
</style>
子界面
<template>
  <div class="circles" ref="circles"></div>
</template>
<script>
export default {
  props: {
    data:Object,
    color:String,
  },
  data() {
    return {};
  },

  mounted() {
    this.$nextTick(() => {
      this.drawLine();
    });
  },
  watch: {
    data: function (newVal, oldVal) {
      this.$nextTick(() => {
        this.drawLine();
      });
    },
  },

  methods: {
    drawLine() {
      let myChart = this.$echarts.init(this.$refs.circles);
      let chartData = {
        caseOccupyTotal: 234,
        caseOccupyData: [
            {
                name: '投放点',
                value: 10,
            },
            {
                name: '小区',
                value: 20,
            },
            {
                name: '公共机构',
                value: 20,
            },
            {
                name: '餐企',
                value: 10,
            },
            {
                name: '医院',
                value: 10,
            },
            {
                name: '商圈',
                value: 10,
            },
            {
                name: '学校',
                value: 4,
            },
            {
                name: '转运站',
                value: 10,
            },
            // {
            //     name: '处理厂',
            //     value: 4,
            // }
        ],
    };

    var data = chartData.caseOccupyData;
    // 总事件数
    let total = chartData.caseOccupyTotal;
    // 副标题
    let subtext = '总事件';
    // 配色数组
    let colors = ['rgba(91, 143, 249, 0.85)', '#00C283', '#5D7092', '#F6BD16','#E8684A','#6DC8EC','#9270CA','rgba(255, 157, 77, 0.85)','rgba(38, 154, 153, 0.85)'];
    var option = {
      title: {
          text: total,
          left: '18%',
          top: '42%',
          itemGap: 0,
          textStyle: {
              color: '#FFFFFF',
              fontSize: '25',
              fontWeight: 400
          },
          subtextStyle: {
              color: 'rgba(255, 255, 255, 0.4)',
              fontSize: '17',
              fontWeight: 400,
              lineHeight: '30'
          }
      },
      color: colors,
      legend: {
          itemWidth:50,
          itemHeight:6,
          icon:'circle',
          show: true,
          left: "60%",
          top: "0",
          itemGap:20,
          formatter: (name) => {
              return (
                  "{name|" + name + "}"
              );
          },
          padding: [0,0,0,0],
          textStyle: {
              color: "#beceff", //元字颜色
              fontSize: 24,
              rich: {
                  name: {
                      color: '#fff',
                      fontSize: 16,
                  }
              }
          },
      },
      tooltip: {
          show: true,
      },
      series: [
      {
          type: 'pie',
          roundCap: 0,
          hoverAnimation: false,
          radius: ['58%', '83%'],
          center: ['25%', '50%'],
          avoidLabelOverlap: false,
          label: {
              show: false,
              position: 'center'
          },
          emphasis: {
              show: false,
          },
          labelLine: {
              show: false
          },
          data: data,
      }]
  };
    myChart.setOption(option);
    window.addEventListener("resize", function () {
      myChart.resize();
    });

  },
  },
};
</script>
<style lang="scss" scoped>
.circles {
  width: 100%;
  height: 100%;
}
</style>
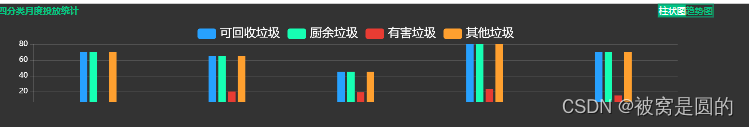
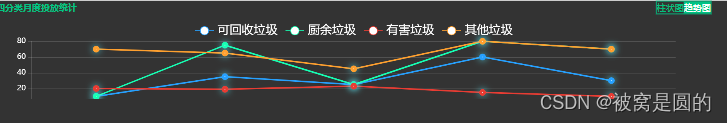
实现效果
实现柱状图和趋势图的切换
目录
父界面
<template>
  <div class="contentBox">
      <div class="mainPart flex">
        <div class="mainPart-l fifth fourSeries">
          <div class="sbflex">
            <h3 class="echarttitle">四分类月度投放统计</h3>
            <div class="fourSeriesBtn flex border">
              <div class="fourSeriesBtn-l whiteColor fifth alignCenter" @click="fouClick('柱状图')"
                :style="{background: fourName == '柱状图' ? '#00C283' : 'none',color: fourName == '柱状图' ? '#fff' : '#00C283'}">
                柱状图</div>
              <div class="fourSeriesBtn-r whiteColor fifth alignCenter" @click="fouClick('趋势图')"
                :style="{background: fourName == '趋势图' ? '#00C283' : 'none',color: fourName == '趋势图' ? '#fff' : '#00C283'}">
                趋势图</div>
            </div>
          </div>
          <div class="fourSeries-b">
            <el-carousel :autoplay="module1" indicator-position="none" :initial-index="fourIndex" :interval="interval" ref="setfouActive"
              @change="qiehuan">
              <el-carousel-item name="柱状图">
                <FourBars :color="fourColor" style="height:20vh;"></FourBars>
              </el-carousel-item>
              <el-carousel-item name="趋势图">
                <FourLines :color="fourColor" style="height:20vh;"></FourLines>
              </el-carousel-item>
            </el-carousel>
          </div>
        </div>
      </div>
  </div>
</template>
<script>
import FourBars from "@/components/echarts/fourbar.vue";
import FourLines from "@/components/echarts/fourline.vue";
export default {
  components: {
    FourBars,
    FourLines,
  },
  data() {
    return {
      fourName: "柱状图",
      fourColor: ["#27A1FF", "#16FFB3", "#E83C33", "#FFA02F"],
      fourIndex: 0,
      interval: 6000,
      canchuIndex: 0,
      module1:false,
      module2:false,
    };
  },

  watch: {
  },
  methods: {
    fouClick(m) {
      this.fourName = m;
      this.$refs.setfouActive.setActiveItem(m);
    },
    qiehuan(m) {
      if (m == 0) {
        this.fourName = "柱状图";
      } else {
        this.fourName = "趋势图";
      }
    },
  },
  mounted() {},
};
</script>
<style lang="scss">
.contentBox{
  background-color: #333;
}

.mainPart {
  margin-top: 45px;

  .mainPart-l {
    .mainPartChart {
      height: 16vh;
    }
  }
  .mainPart-r {
    .flex {
      align-items: center;
    }
  }
}
   .fourSeries-b {
      height: 40vh;}

</style>
子界面fourbar
<template>
  <div class="fourbar" ref="fourbar"></div>
</template>
<script>
export default {
  props: {
    data: Object,
    color:Array,
    dem:String
  },
  data() {
    return {};
  },

  mounted() {
    this.$nextTick(() => {
      this.drawLine();
    });
  },
  watch: {
    data: function (newVal, oldVal) {
      this.$nextTick(() => {
        this.drawLine();
      });
    },
  },

  methods: {
    drawLine() {
      let myChart = this.$echarts.init(this.$refs.fourbar);

      var option = {
          tooltip: {
              trigger: 'axis',
              axisPointer: {
                  type: 'shadow'
              }
          },
          legend: {
              top: '5%',
              data: ['可回收垃圾', '厨余垃圾', '有害垃圾','其他垃圾'],
              textStyle: {
                color: '#fff',
                fontSize:'16'
              },
          },
          grid: {
              top:'20%',
              left:'5%',
              right:'5%',
              botton:'5%'
          },
          xAxis: {
              type: 'category',
              data: ['01', '02', '03', '04', '05','06','07','08','09','10','11','12'],
              axisLabel: {
                color: "#fff",
                fontSize: "14px"
              },
              axisLine: {
                lineStyle: {
                  color: "rgba(255, 255, 255, 0.15)",
                  // width: 1 //这里是坐标轴的宽度
                }
              },
          },
          yAxis: {
              type: 'value',
              axisLine: {
                lineStyle: {
                  color: "rgba(255, 255, 255, 0.15)",
                  // width: 1 //这里是坐标轴的宽度
                }
              },
              splitLine: {
                show: true,
                lineStyle: {
                  color: "rgba(255, 255, 255, 0.15)",
                  // width: 2
                }
              },
              axisLabel: {
                color: "#fff",
                fontSize: "14px"
              },
          },
          dataZoom: [{
              type: 'slider',
              show: true,
              xAxisIndex: [0],
              left: '0',
              bottom: -5,
              start: 0,
              end:40, //初始化滚动条
              height:14,
              borderColor: "rgba(255, 255, 255, 0.6);",
              fillerColor: '#00C283',
              // backgroundColor: 'rgba(255, 255, 255, 0.6);',//两边未选中的滑动条区域的颜色
              showDataShadow: false,//是否显示数据阴影 默认auto
              showDetail: false,//即拖拽时候是否显示详细数值信息 默认true
              realtime:true, //是否实时更新
              filterMode: 'filter',
          }],
          tooltip: {
            trigger: 'axis',
            axisPointer: {
              type: 'shadow'
            },
            formatter: function(parma) {
              let str = '2021-' +  parma[0].name + '</br>'
              str = str +  "<span style='color: #2189D9;margin-right:45px;'>可回收</span><span>" + parma[0].data + "吨</span></br>"
              str = str +  "<span style='color: #13D998;margin-right:30px;'>厨余垃圾</span><span>" + parma[1].data + "吨</span></br>"
              str = str +  "<span style='color: #C3322A;margin-right:30px;'>有害垃圾</span><span>" + parma[2].data + "吨</span></br>"
              str = str +  "<span style='color: #D98828;margin-right:30px;'>其他垃圾</span><span>" + parma[3].data + "吨</span></br>"

              return str
            }
          },
          series: [{
              name: '可回收垃圾',
              data: [70, 65, 45, 80, 70, 78, 14,20,19,23,15,10],
              type: 'bar',
              barWidth:10,
              itemStyle: {
                  color:this.color[0]
              }

          },
          {
              name: '厨余垃圾',
              data: [70, 65, 45, 80, 70, 78, 14,20,19,23,15,10],
              type: 'bar',
              barWidth:10,
              itemStyle: {
                  color:this.color[1]
              }
          },
          {
              name: '有害垃圾',
              data: [,20,19,23,15,10,70, 65, 45, 80, 70, 78, 14],
              type: 'bar',
              barWidth:10,
              itemStyle: {
                  color:this.color[2]
              }
          },{
              name: '其他垃圾',
              data: [70, 65, 45, 80, 70, 78, 14,20,19,23,15,10],
              type: 'bar',
              barWidth:10,
              itemStyle: {
                  color:this.color[3]
              }
          }]
      };
      myChart.setOption(option);
      window.addEventListener("resize", function () {
        myChart.resize();
      });

    },
  },
};
</script>
<style lang="scss" scoped>
.fourbar {
  width: 100%;
  height: 100%;
}
</style>
子界面fourline
<template>
  <div class="fourline" ref="fourline"></div>
</template>
<script>
export default {
  props: {
    data: Object,
    color:Array,
    dem:String
  },
  data() {
    return {};
  },

  mounted() {
    this.$nextTick(() => {
      this.drawLine();
    });
  },
  watch: {
    data: function (newVal, oldVal) {
      this.$nextTick(() => {
        this.drawLine();
      });
    },
  },

  methods: {
    drawLine() {
      let myChart = this.$echarts.init(this.$refs.fourline);

      var option = {
          tooltip: {
              trigger: 'axis',
              axisPointer: {
                  type: 'shadow'
              }
          },
          legend: {
              top: '5%',
              data: ['可回收垃圾', '厨余垃圾', '有害垃圾','其他垃圾'],
              textStyle: {
                color: '#fff',
                fontSize:'16'
              },
          },
          grid: {
              top:'20%',
              left:'5%',
              right:'5%',
              botton:'5%'
          },
          xAxis: {
              type: 'category',
              data: ['01', '02', '03', '04', '05','06','07','08','09','10','11','12'],
              axisLabel: {
                color: "#fff",
                fontSize: "14px"
              },
              axisLine: {
                lineStyle: {
                  color: "rgba(255, 255, 255, 0.15)",
                  // width: 1 //这里是坐标轴的宽度
                }
              },
          },
          yAxis: {
              type: 'value',
              axisLine: {
                lineStyle: {
                  color: "rgba(255, 255, 255, 0.15)",
                  // width: 1 //这里是坐标轴的宽度
                }
              },
              splitLine: {
                show: true,
                lineStyle: {
                  color: "rgba(255, 255, 255, 0.15)",
                  // width: 2
                }
              },
              axisLabel: {
                color: "#fff",
                fontSize: "14px"
              },
          },
          dataZoom: [{
              type: 'slider',
              show: true,
              xAxisIndex: [0],
              left: '0',
              bottom: -5,
              start: 0,
              end:40, //初始化滚动条
              height:14,
              borderColor: "rgba(255, 255, 255, 0.6);",
              fillerColor: '#00C283',
              // backgroundColor: 'rgba(255, 255, 255, 0.6);',//两边未选中的滑动条区域的颜色
              showDataShadow: false,//是否显示数据阴影 默认auto
              showDetail: false,//即拖拽时候是否显示详细数值信息 默认true
              realtime:true, //是否实时更新
              filterMode: 'filter',
          }],
          tooltip: {
            trigger: 'axis',
            axisPointer: {
              type: 'shadow'
            },
            formatter: function(parma) {
              let str = '2021-' +  parma[0].name + '</br>'
              str = str +  "<span style='color: #2189D9;margin-right:45px;'>可回收</span><span>" + parma[0].data + "吨</span></br>"
              str = str +  "<span style='color: #13D998;margin-right:30px;'>厨余垃圾</span><span>" + parma[1].data + "吨</span></br>"
              str = str +  "<span style='color: #C3322A;margin-right:30px;'>有害垃圾</span><span>" + parma[2].data + "吨</span></br>"
              str = str +  "<span style='color: #D98828;margin-right:30px;'>其他垃圾</span><span>" + parma[3].data + "吨</span></br>"
              return str
            }
          },
          series: [{
              name: '可回收垃圾',
              data: [10, 35, 25, 60, 30, 58, 34,60,29,53,25,50],
              type: 'line',
              symbolSize: 4,
              itemStyle: {
                normal: {
                  borderWidth: 5,
                  color: this.color[0],
                  shadowColor: 'rgba(93,241,255 ,0.7)',
                  shadowBlur: 10,
                },
              }

          },
          {
              name: '厨余垃圾',
              data: [10, 75, 25, 80, 70, 78, 14,20,19,23,15,10],
              type: 'line',
              symbolSize: 4,
              itemStyle: {
                normal: {
                  borderWidth: 5,
                  color: this.color[1],
                  shadowColor: 'rgba(93,241,255 ,0.7)',
                  shadowBlur: 10,
                },
              }
          },
          {
              name: '有害垃圾',
              data: [20,19,23,15,10,70, 65, 45, 80, 70, 78, 14],
              type: 'line',
              symbolSize: 4,
              itemStyle: {
                normal: {
                  borderWidth: 5,
                  color: this.color[2],
                  shadowColor: 'rgba(93,241,255 ,0.7)',
                  shadowBlur: 10,
                },
              }
          },{
              name: '其他垃圾',
              data: [70, 65, 45, 80, 70, 78, 14,20,19,23,15,10],
              type: 'line',
              symbolSize: 4,
              itemStyle: {
                normal: {
                  borderWidth: 5,
                  color: this.color[3],
                  shadowColor: 'rgba(93,241,255 ,0.7)',
                  shadowBlur: 10,
                },
              }
          }]
      };
      myChart.setOption(option);
      window.addEventListener("resize", function () {
        myChart.resize();
      });

    },
  },
};
</script>
<style lang="scss" scoped>
.fourline {
  width: 100%;
  height: 100%;
}
</style>
实现效果


 4835
4835

 被折叠的 条评论
为什么被折叠?
被折叠的 条评论
为什么被折叠?
 到【灌水乐园】发言


