


 该文章介绍了如何使用Matlab进行一维小波分解算法(WaveletDecomposition)来分解信号。通过示例代码展示了如何计算数据在向量方向上的投影,并进行数据可视化,将2D数据降维至1D的过程。
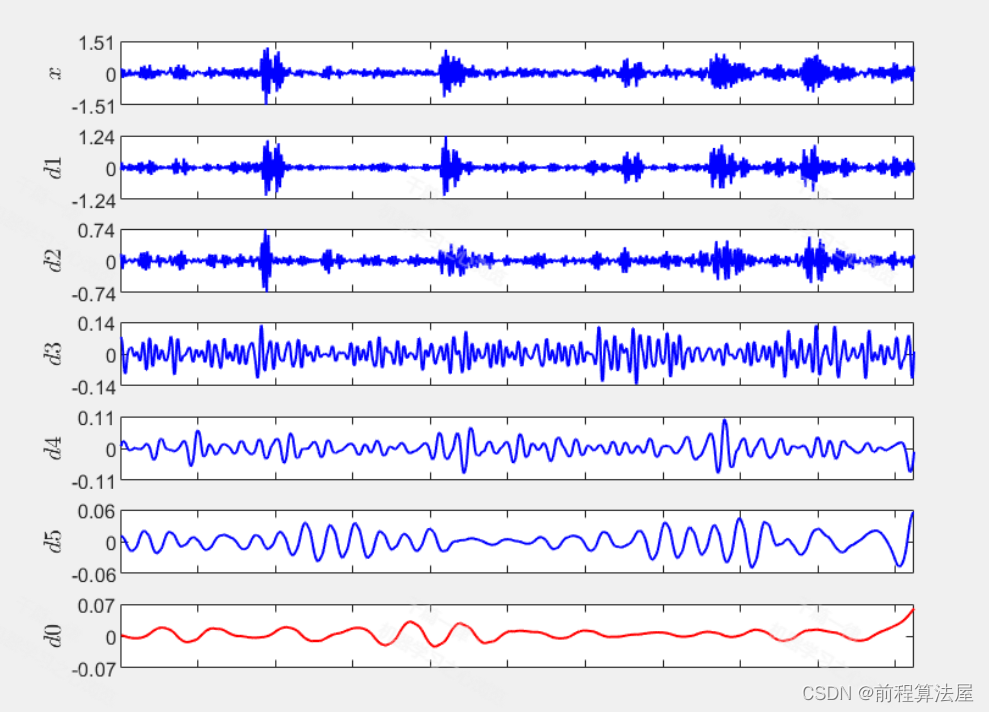
效果一览
文章概述
信号分解算法 | Matlab基于一维小波分解算法(Wavelet Decomposition)的信号分解算法
部分源码
%--------------------------------------------------------------------------------------------------------------------------------------------------------------------------------------------------------------------------------------------------------------------
bound = 5;                      % Display boudary x[-5 5] y[-5 5]
theta = linspace(0,pi,60);%0:0.02:pi;              % The theta of vector / line
[~,n] = size(theta);            % Get the size of theta
vec = [cos(theta); sin(theta)]; % Generate vector for theta
XRange = [-bound;bound];        % X range
YRangeSet = [XRange(1).*tan(theta); XRange(2).*tan(theta)]; % Y range set
dist = vec'*data;               % Dot product of vector and data to obtain the length on vector's direction
%--------------------------------------------------------------------------------------------------------------------------------------------------------------------------------------------------------------------------------------------------------------------
% Draw
figure(1);
axis([XRange',XRange']);
hold on;
%--------------------------------------------------------------------------------------------------------------------------------------------------------------------------------------------------------------------------------------------------------------------
%pic_num = 1;
for i = 1:n
    cla;                            % Clear figure
    YRange = YRangeSet(:,i);        % Obtain the current YRange
    the = theta(i);                 % Obtain the current theta
    coordinate = [dist(i,:).*cos(the); dist(i,:).*sin(the)];    % Obtain the coordinate of the projection point
    plot(data(1,:),data(2,:),'b.','MarkerSize',10);             % Plot original data
    drawLine(XRange, YRange, the);                              % Draw feature %--------------------------------------------------------------------------------------------------------------------------------------------------------------------------------------------------------------------------------------------------------------------
    plot(coordinate(1,:),coordinate(2,:),'r.','MarkerSize',10); % Draw projection points
    X = [data(1,:);coordinate(1,:)];
    Y =[data(2,:); coordinate(2,:)];
    line(X,Y,'color','r');                                      % connect the original data to projection points
    gca = legend('original data','feature plane', 'projection data'); % Add %--------------------------------------------------------------------------------------------------------------------------------------------------------------------------------------------------------------------------------------------------------------------
    % Add labels and titles
    xlabel('x');    ylabel('y');    title('Dimension Reduction (from 2-dim to 1-dim)');
    drawnow();                      % Display
%--------------------------------------------------------------------------------------------------------------------------------------------------------------------------------------------------------------------------------------------------------------------
    % Just for gif generation
    % F=getframe(gcf);
%--------------------------------------------------------------------------------------------------------------------------------------------------------------------------------------------------------------------------------------------------------------------
    % [I,map]=rgb2ind(I,256);
    % if pic_num == 1
    %     imwrite(I,map,'test.gif','gif','Loopcount',inf,'DelayTime',0.2);
    % else
    %     imwrite(I,map,'test.gif','gif','WriteMode','append','DelayTime',0.2);
    % end
    %pic_num = pic_num + 1;
%--------------------------------------------------------------------------------------------------------------------------------------------------------------------------------------------------------------------------------------------------------------------
end
hold off
%--------------------------------------------------------------------------------------------------------------------------------------------------------------------------------------------------------------------------------------------------------------------

function drawLine(XRange,YRange,theta)
    if(YRange(1)<XRange(1) || YRange(1) > XRange(2))
%--------------------------------------------------------------------------------------------------------------------------------------------------------------------------------------------------------------------------------------------------------------------
            YRange = XRange;
            XRange = YRange./tan(theta);
%--------------------------------------------------------------------------------------------------------------------------------------------------------------------------------------------------------------------------------------------------------------------
            YRange = fliplr(XRange);
            XRange = YRange./tan(theta);
        end
    end
    line([XRange(1),XRange(2)],[YRange(1), YRange(2)],'color','k');
end
%--------------------------------------------------------------------------------------------------------------------------------------------------------------------------------------------------------------------------------------------------------------------
参考资料
[1] https://blog.youkuaiyun.com/m0_57362105/article/details/130383523?spm=1001.2014.3001.5502


 被折叠的 条评论
为什么被折叠?
被折叠的 条评论
为什么被折叠?
 到【灌水乐园】发言


