


 本文详细描述了如何在Ceph集群中启用和配置Prometheus监控,包括在cephmgr端安装Cherrypy模块、设置prometheus.yml文件、调整端口以及在Grafana中导入监控模板的过程。
prometheus监控ceph集群
1.ceph mgr端配置
1.1.ceph mgr 启动prometheus模块
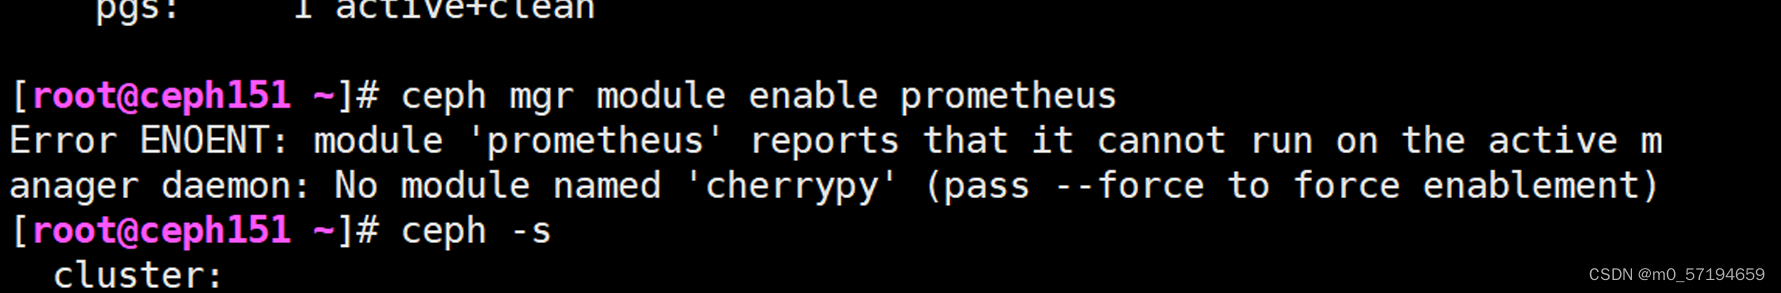
ceph mgr module enable prometheus执行报错:
1.2下载 cherrypy模块
pip3 install cherrypy -i https://mirrors.aliyun.com/pypi/simple1.3启动cherrypy模块:
 ceph mgr module enable cherrypy
  #执行报错使用--force
  #ceph mgr module enable cherrypy --force
1.4启动prometheus模块
 ceph mgr module enable prometheus
  #执行报错使用--force
  #ceph mgr module enable prometheus --force
1.5.检查端口
 ss -lnt
 #默认监控模块端口号是9283
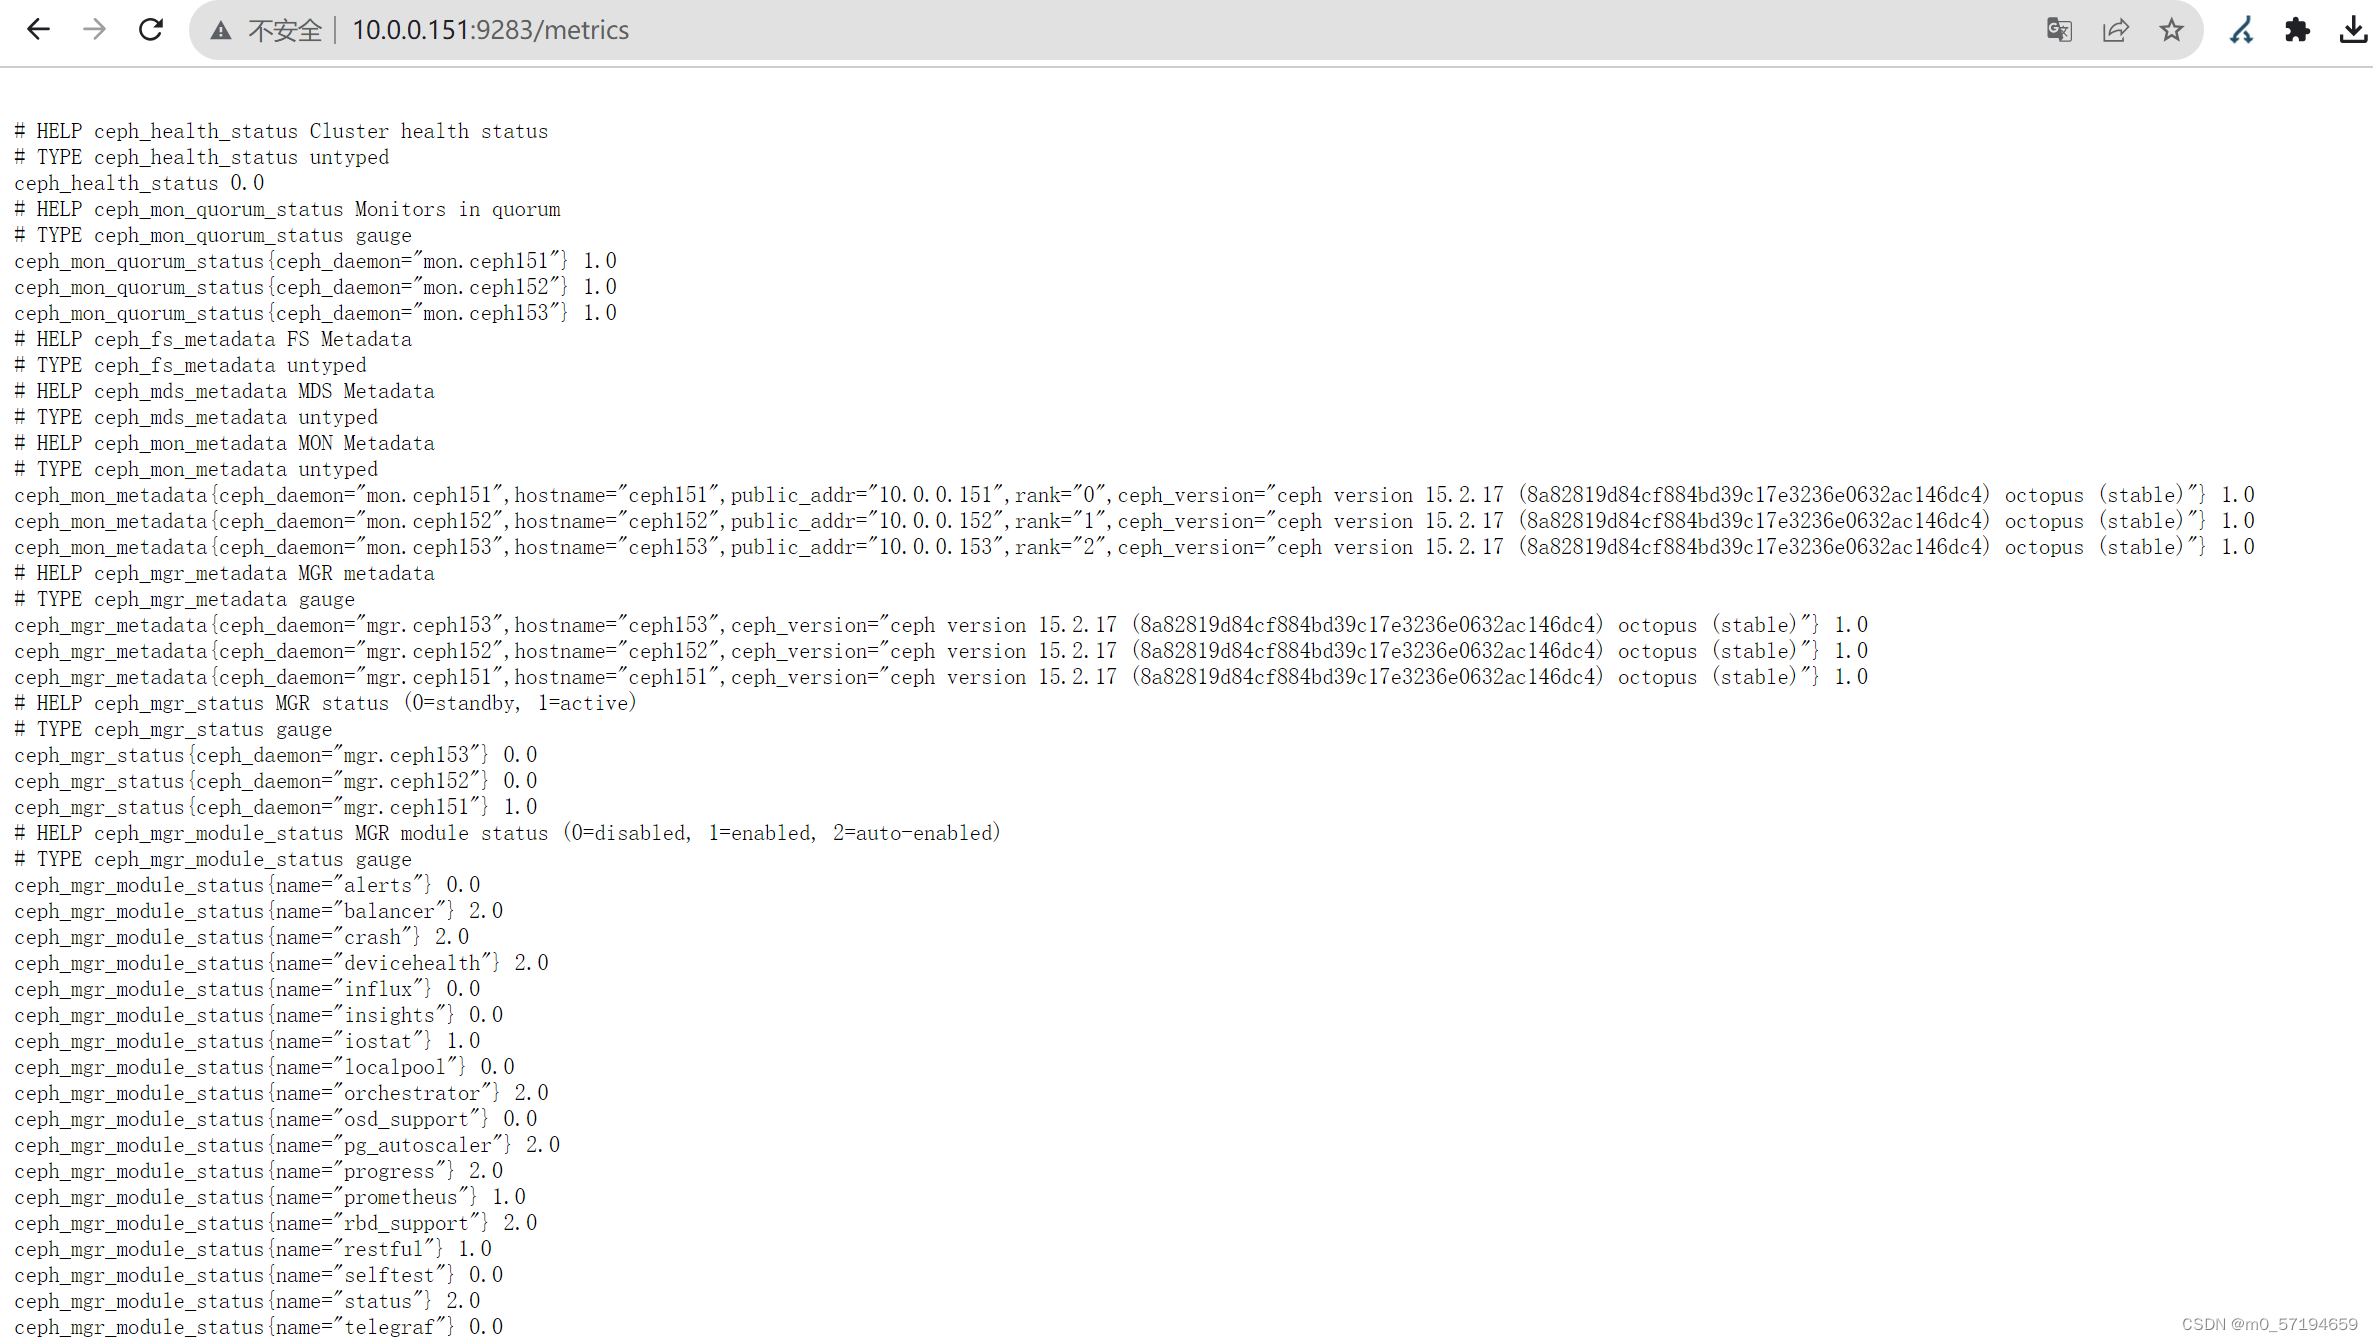
1.6 web 界面查看是否有数据
2.prometheus配置监控ceph
2.1修改prometheus.yml配置文件
#监控ceph集群
- job_name: 'ceph'
static_configs:
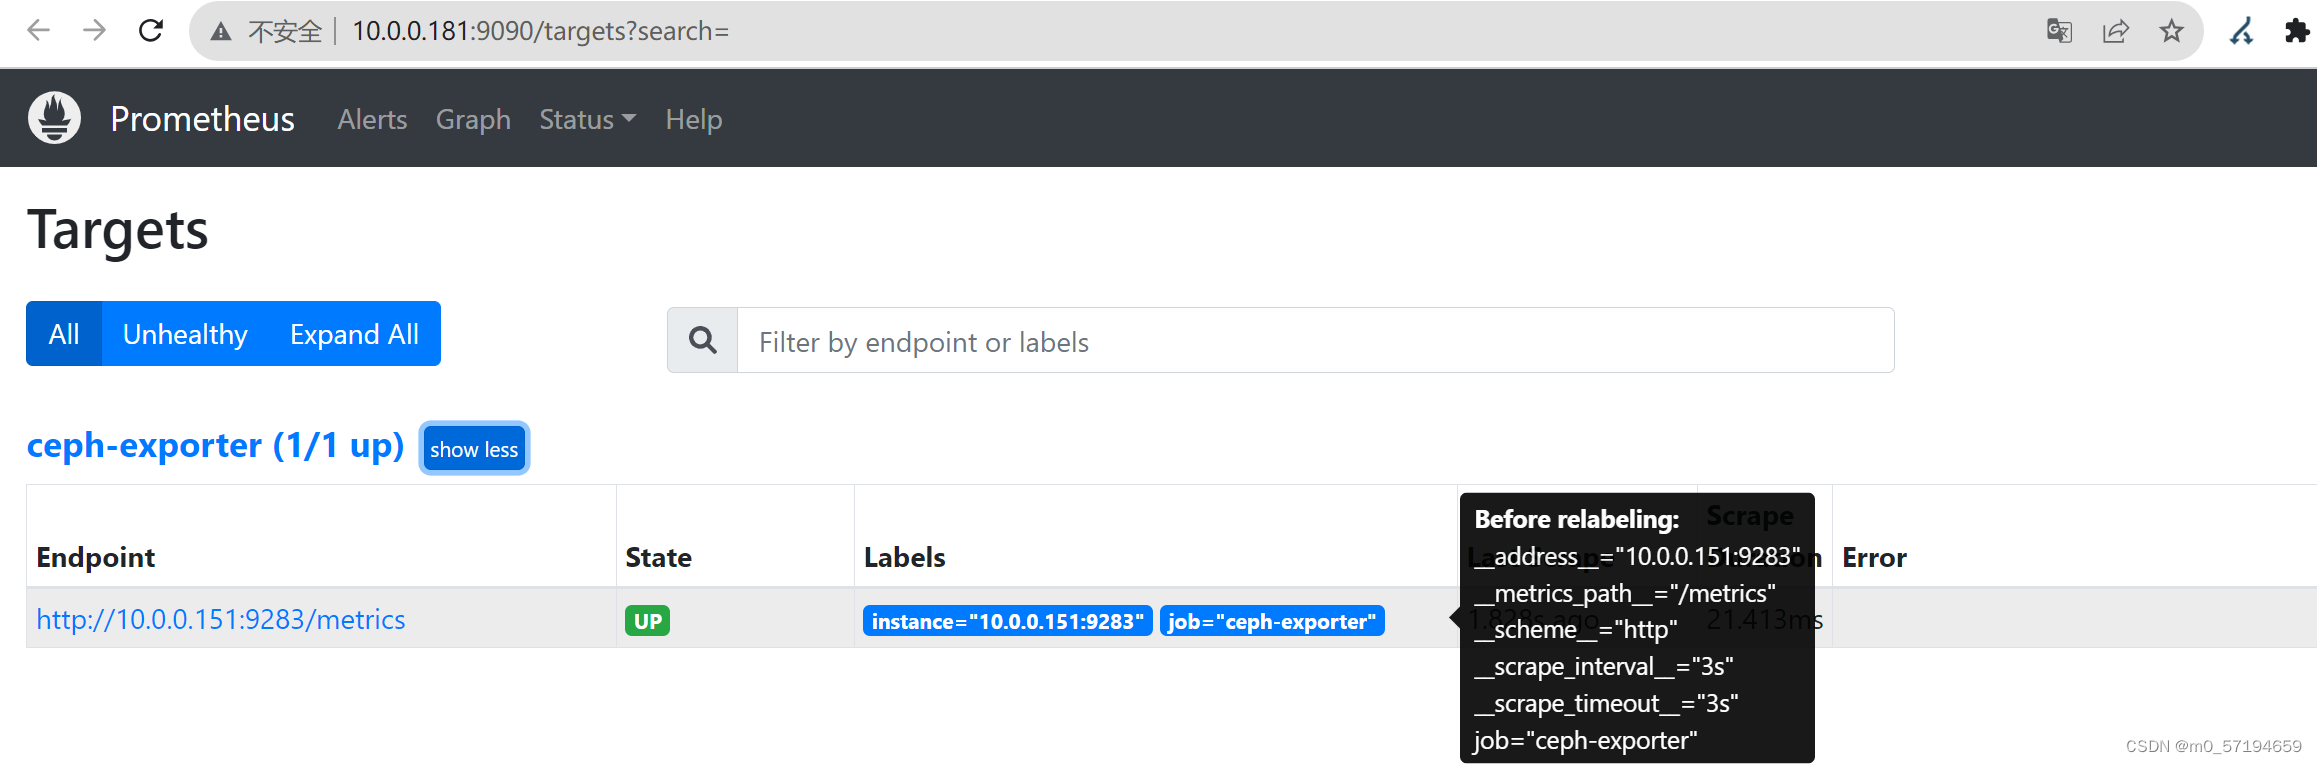
- targets: ["10.0.0.151:9283"]2.2 加载配置文件
curl -X POST http://10.0.0.31:9090/-/reload2.3 访问Prometheus 9090端口检查是否监控到ceph集群
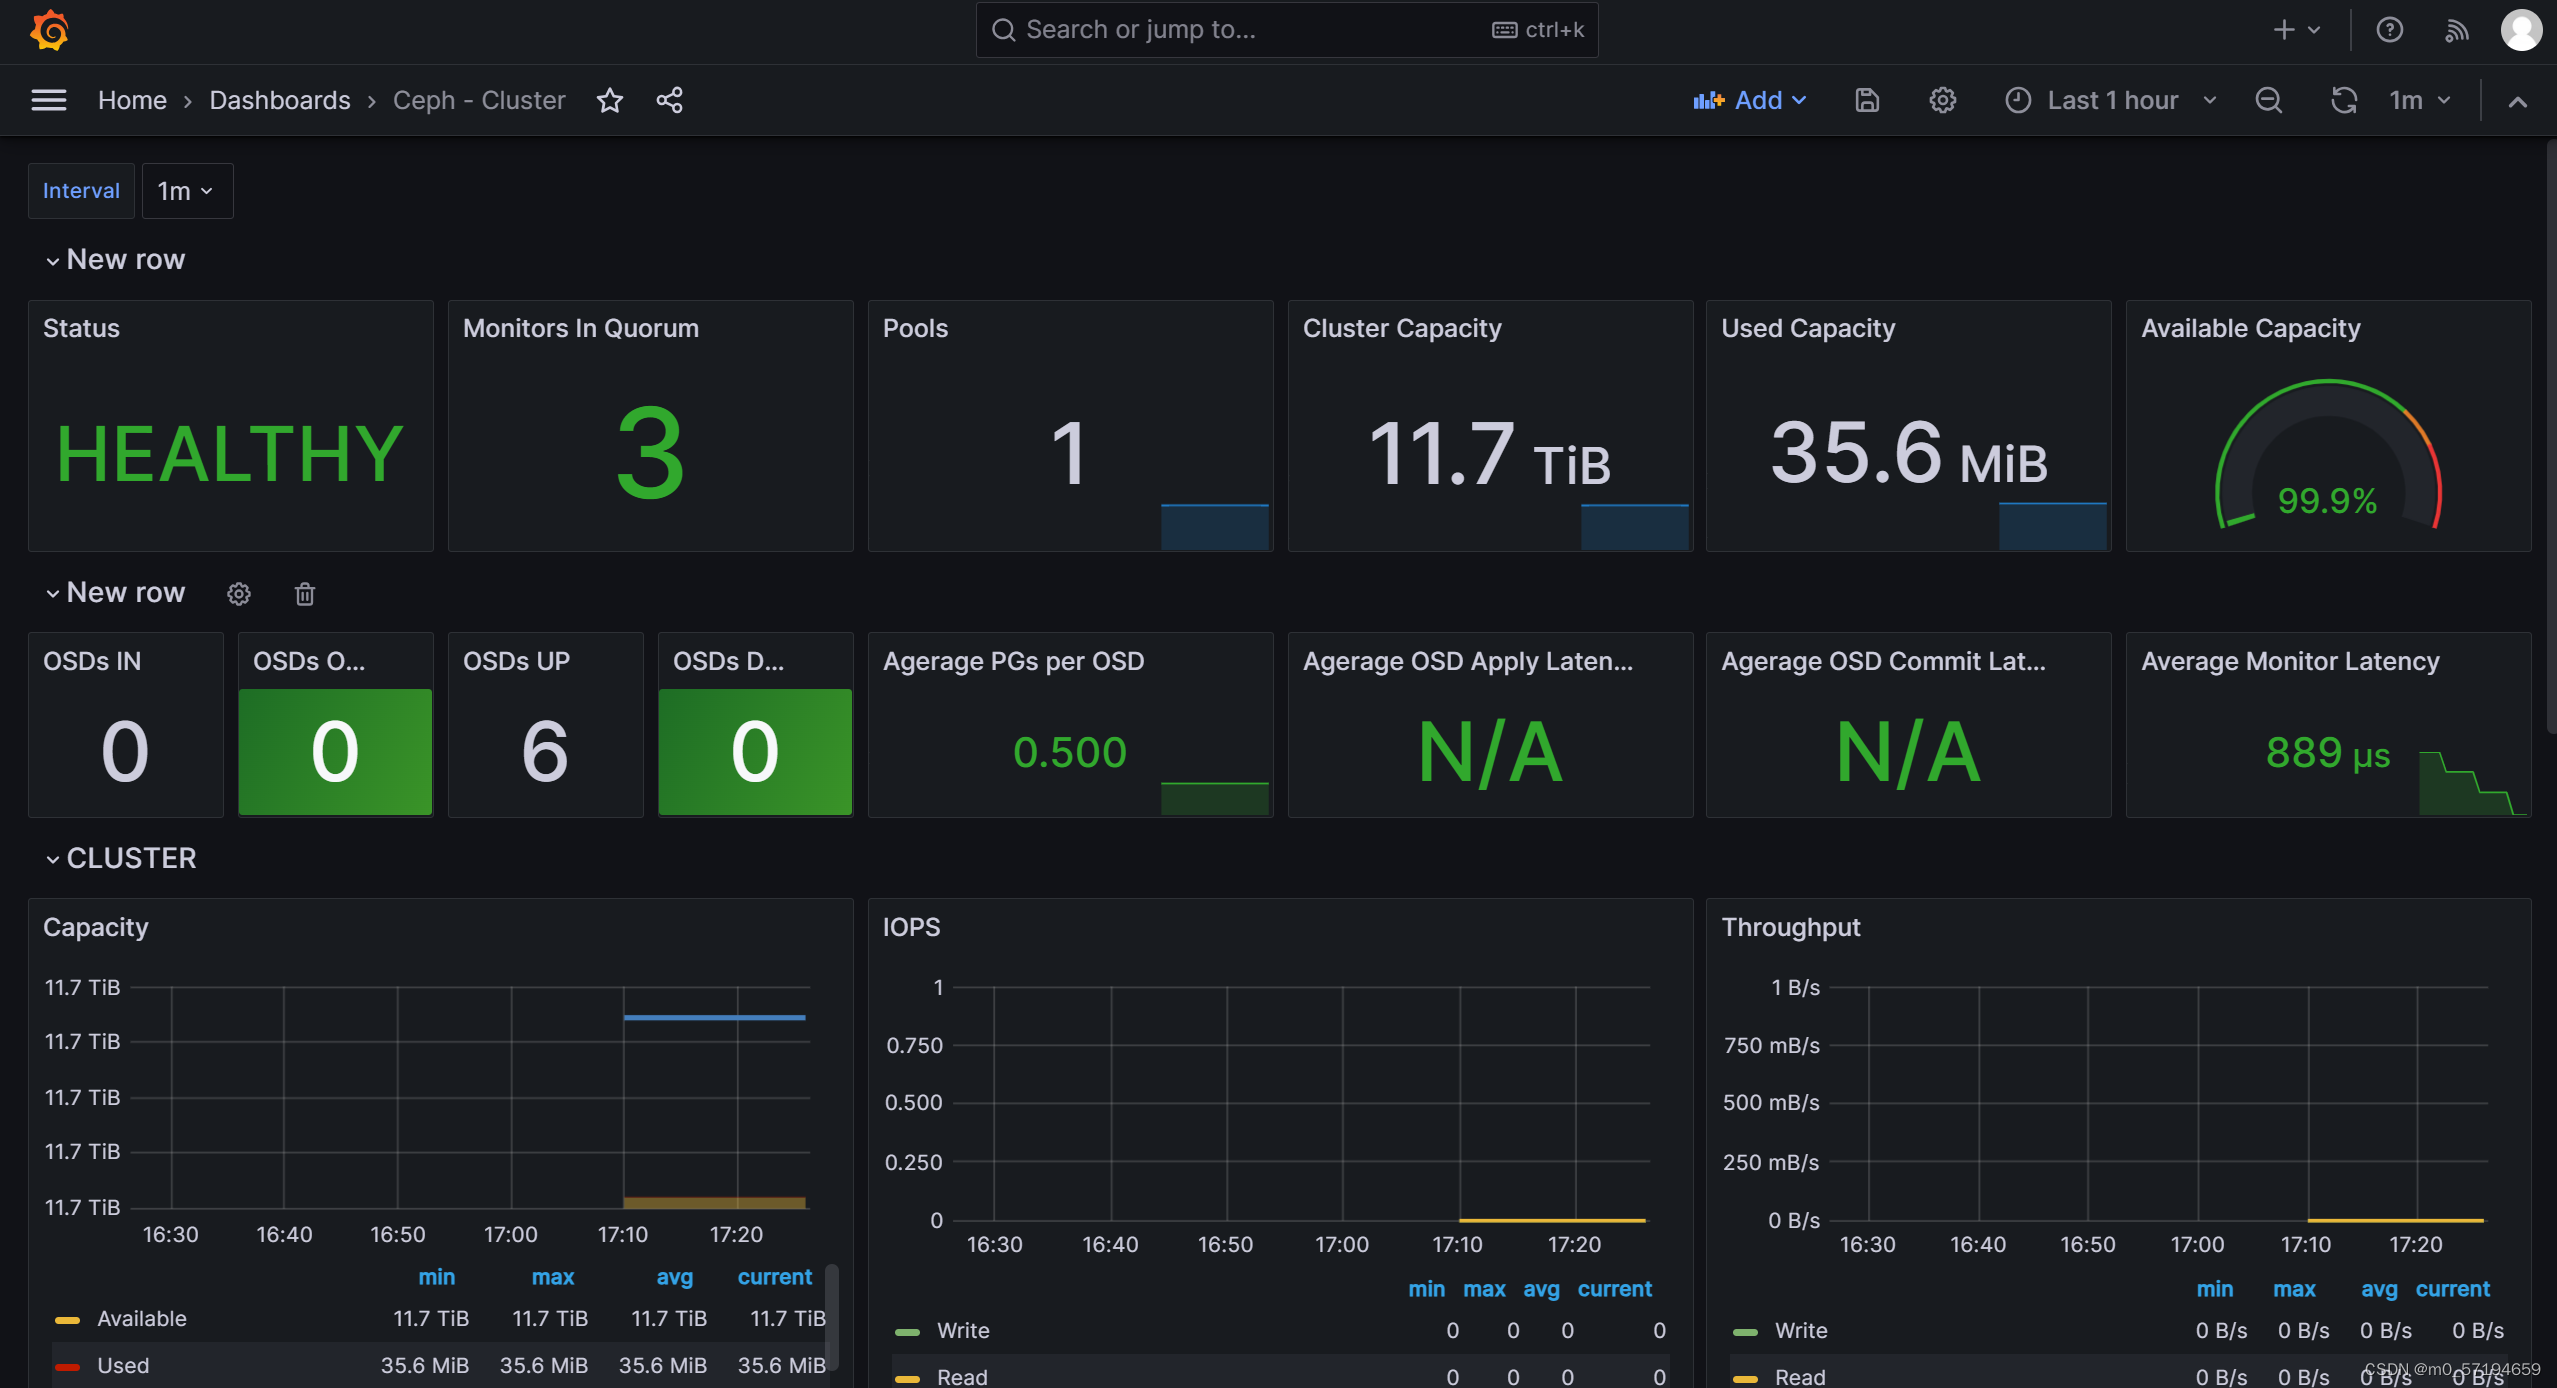
2.4 配置grafana导入监控模板
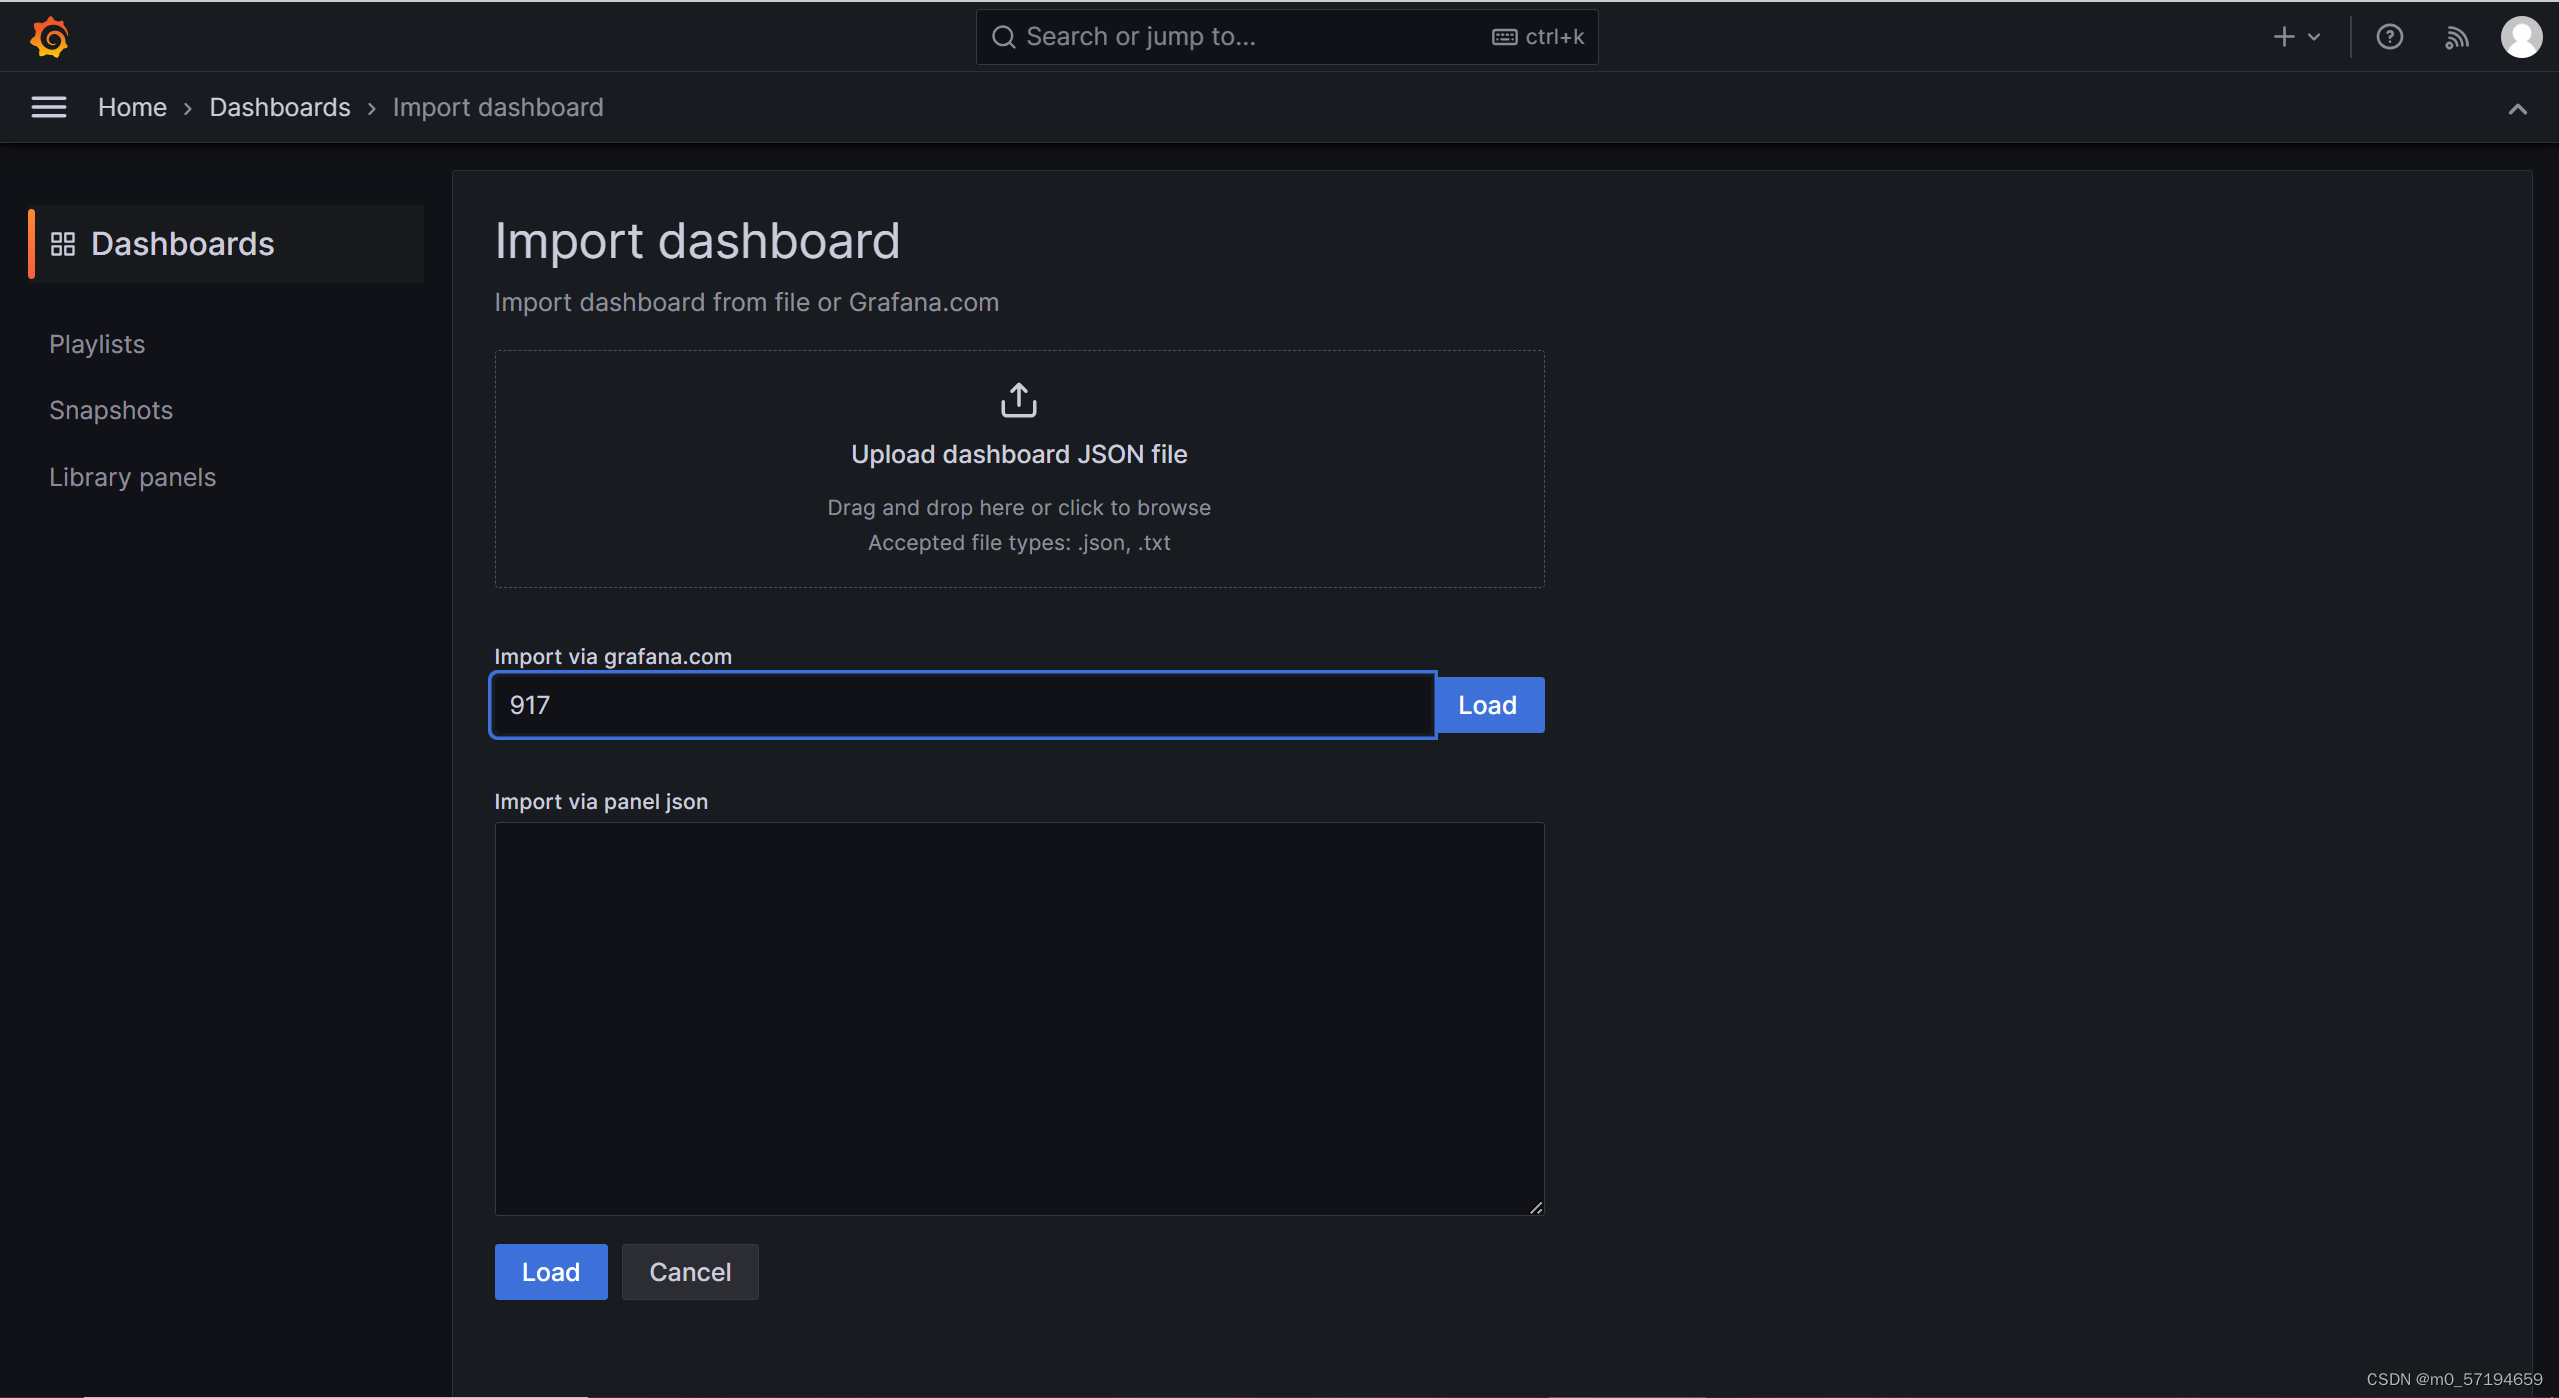
模版ID:917
2.5 查看Dashboards


 被折叠的 条评论
为什么被折叠?
被折叠的 条评论
为什么被折叠?
 到【灌水乐园】发言


