地图代码
<template>
    <div id="dt" style="width: 100%;height:100%;"></div>
</template>

<script lang="ts" setup>
    import * as echarts from 'echarts';
    import { onMounted,ref } from 'vue';
    const mapList = ref([
        {name:"温岭市",value:80},
        {name:"椒江区",value:50},
        {name:"路桥区",value:50}
    ])
    onMounted(()=>{
        getEcharts();
    })
    const getEcharts = () => {
        let chartDom:any = document.getElementById('bt');
        let getJson = ""
        let getJson1 = ""
        let myChart = echarts.init(chartDom);
        //对每个地区定位,水滴显示
	    let convertData = function(arr) {
			let res = [];
			for (let i = 0; i < arr.length; i++) {
				let geoCoord = getJson1[arr[i].name];
				if (geoCoord) {
					res.push({
						name: arr[i].name,
						value: geoCoord.concat(arr[i].value)
					});
				}
			}
			return res;
		};
        //引入绘制地图json
		echarts.registerMap('map', getJson, {});
		let option = {
			tooltip: {
				// backgroundColor: "#062444",
				// borderColor: "#ff2b73",
				triggerOn: 'mousemove', //click
				enterable: true,
				// formatter: '{b}<br/>{c} (p / km2)'
				formatter: function(params) { //用于显示多个数据
					let tipHtml = params.name;
					return tipHtml;
				}
			},
			geo: {
				show: true,
				aspectScale: 1, //地图长度比
				zoom: 1.1,
				map: 'map',
				label: {
					normal: {
						show: false
					},
					emphasis: {
						show: false,
					}
				},
				roam: false, //地图设置不可拖拽,固定的
				itemStyle: {
					// normal: {
					// 	areaColor: '#00406b',
					// 	borderWidth: 1,
					// 	shadowColor: '#00406b',
					// 	shadowBlur: 100,
					// }
					normal: { //未选中状态
						borderColor: 'rgba(147, 235, 248, 1)',
						borderWidth: 1,
						areaColor: {
							type: 'radial',
							x: 0.5,
							y: 0.5,
							r: 0.8,
							colorStops: [{
								offset: 0,
								color: 'rgba(147, 235, 248, 0)' // 0% 处的颜色
							}, {
								offset: 1,
								color: 'rgba(147, 235, 248, .2)' // 100% 处的颜色
							}],
							globalCoord: false // 缺省为 false
						},
						shadowColor: 'rgba(128, 217, 248, 1)',
						// shadowColor: 'rgba(255, 255, 255, 1)',
						shadowOffsetX: -2,
						shadowOffsetY: 2,
						shadowBlur: 10
					},
					emphasis: { // 移动样式
						areaColor: '#389BB7',
						borderWidth: 0
					}
				}
			},
			series: [{
				select: {
					label: {
						show: true,
						color: '#fff'
					},
					itemStyle: { //选择后的样式
						borderColor: '#a5f2fc',
						borderWidth: 1,
						color: {
							type: 'radial',
							x: 0.5,
							y: 0.5,
							r: 0.8,
							colorStops: [{
								offset: 0,
								color: 'rgba(147, 235, 248, 0)' // 0% 处的颜色
							}, {
								offset: 1,
								color: 'rgba(147, 235, 248, 1)' // 100% 处的颜色
							}],
							globalCoord: false // 缺省为 false
						},
					}
				},
				name: '',
				itemStyle: {
					normal: { //未选中状态
						borderColor: 'rgba(147, 235, 248, 1)',
						borderWidth: 1,
						areaColor: {
							type: 'radial',
							x: 0.5,
							y: 0.5,
							r: 0.8,
							colorStops: [{
								offset: 0,
								color: 'rgba(147, 235, 248, 0)' // 0% 处的颜色
							}, {
								offset: 1,
								color: 'rgba(147, 235, 248, .2)' // 100% 处的颜色
							}],
							globalCoord: false // 缺省为 false
						},
						shadowColor: 'rgba(128, 217, 248, 1)',
						// shadowColor: 'rgba(255, 255, 255, 1)',
						shadowOffsetX: -2,
						shadowOffsetY: 2,
						shadowBlur: 10
					},
					emphasis: { // 移动样式
						areaColor: {
							type: 'radial',
							x: 0.5,
							y: 0.5,
							r: 0.8,
							colorStops: [{
								offset: 0,
								color: 'rgba(147, 235, 248, 0)' // 0% 处的颜色
							}, {
								offset: 1,
								color: 'rgba(147, 235, 248, 1)' // 100% 处的颜色
							}],
							globalCoord: false // 缺省为 false
						},
						borderWidth: 0
					}
				},
				type: 'map',
				mapType: 'map',
				aspectScale: 1, //地图长度比
				zoom: 1.1,
				label: {
					normal: {
						show: true,
						textStyle: {
							color: '#fff',
							fontSize: 10,
							fontWeight: 'bold'
						}
					},
					emphasis: {
						show: true,
						textStyle: {
							color: '#fff'
						}
					}
				},
				data: mapList.value
			},{
				name: 'Top 5',
				type: 'scatter',
				coordinateSystem: 'geo',
				symbol: 'pin',
				data:convertData(mapList.value),
				symbolSize: [45, 45],//水滴大小
				label: {
					normal: {
						show: true,
						textStyle: {
							color: '#fff',
							fontSize: 9,//字体
						},
						formatter(value) {
							return value.data.value[2]
						}
					}
				},
				itemStyle: {
					normal: {
						color: "rgba(1, 29, 91, 1)",//水滴颜色
						// borderColor: '#0be7a5'
					},
					// emphasis: {
					// 	color: '#e4b500', //标志颜色
					// 	borderColor: '#286291'
					// }
				},
				showEffectOn: 'render',
				rippleEffect: {
					brushType: 'stroke'
				},
				hoverAnimation: true,
				zlevel: 1
			}]
		}
		myChart.setOption(option);
		myChart.on('click', function (params) {

		});

    }
</script>
横向柱状图代码
<template>
    <div id="hxzz" style="width: 100%;height:100%;"></div>
</template>

<script lang="ts" setup>
    import * as echarts from 'echarts';
    import { onMounted,ref } from 'vue';
    const mapList= ref([
        {name:"测试数据1",value:50},
        {name:"测试数据2",value:50},
        {name:"测试数据3",value:50}
    ])
    onMounted(()=>{
        getEcharts();
    })
    const getEcharts = () => {
        let chartDom:any = document.getElementById('hxzz');
        let myChart = echarts.init(chartDom);
        let yLabel = []
		let yData = []
		mapList.value.forEach(val=>{
			yLabel.push(val.name)
			yData.push(val.value)
		})
	    let colorList = ['#fb4d4b', '#f39c12', '#00a65a', "#1DE9B6", "#EEDD78","#32C5E9", "#FFDB5C","#37A2DA", "#04B9FF"]
		let dfColor = {
			type: 'linear',
			x: 0,
			y: 0,
			x2: 1,
			y2: 0,
			colorStops: [{
				offset: 1,
				color: '#0489f0' // 0% 处的颜色
			}, {
				offset: 0,
				color: '#28d9e8' // 100% 处的颜色
			}],
			global: false // 缺省为 false

		};
		yData.forEach((val, index) => {
			let col = ""
			colorList.forEach((v, i) => {
				if (index == i) {
					col = v
				}
			})
			yData1.push({
				value: val,
				itemStyle: {
					color: col == "" ? dfColor : col
				}
			})

		})
		let option = {
			grid: {
				left: '5%',
				right: '5%',
				bottom: '5%',
				top: '10%',
				containLabel: true
			},
			tooltip: {
				trigger: 'axis',
				axisPointer: {
					type: 'none'
				},
				formatter: function(params) {
					return params[0].name + '<br/>' +
						"<span style='display:inline-block;margin-right:5px;border-radius:10px;width:9px;height:9px;background-color:rgba(36,207,233,0.9)'></span>" +
						params[0].seriesName + ' : ' + params[0].value + ' <br/>'
				}
			},
			xAxis: {
				type: 'value',
				axisLine: {
					show: false,
					lineStyle: {
						color: '#2f4475',
						type: "dashed"
					},
				},
				position: 'top',
				splitLine: {
					show: false,
				},
				axisLabel: {
					show: false,
					fontFamily: 'MicrosoftYaHei',
					fontSize: 12,
					color: '#a6acbe'
				},
				axisTick: {
					show: false,
					alignWithLabel: true,
				},
			},
			yAxis: [{
					type: 'category',
					inverse: true,
					axisLabel: {
						show: true,
						margin: 15,
						textStyle: {
							color: '#dddddd',
						},
					},
					splitLine: {
						show: false
					},
					axisTick: {
						show: false
					},
					axisLine: {
						show: true
					},
					data: yLabel
				},
				// {
				//        type: 'category',
				//        inverse: true,
				//        axisTick: 'none',
				//        axisLine: 'none',
				//        show: true,
				//        axisLabel: {
				//            textStyle: {
				//                color: '#dddddd',
				//                fontSize: '12'
				//            },
				// 		},
				// 	data: yData
				// },
			],
			series: [{
				name: '数量',
				type: 'bar',
				zlevel: 1,
				itemStyle: {
					normal: {
						barBorderRadius: [0, 30, 30, 0],
						color: [],
						shadowBlur: 0,
						shadowColor: 'rgba(87,220,222,0.7)'
					},
				},
				barWidth: 10,
				data: yData1
			}, ]
		};


		myChart.setOption(option);
		myChart.on('click', function (params) {

		});

    }
</script>
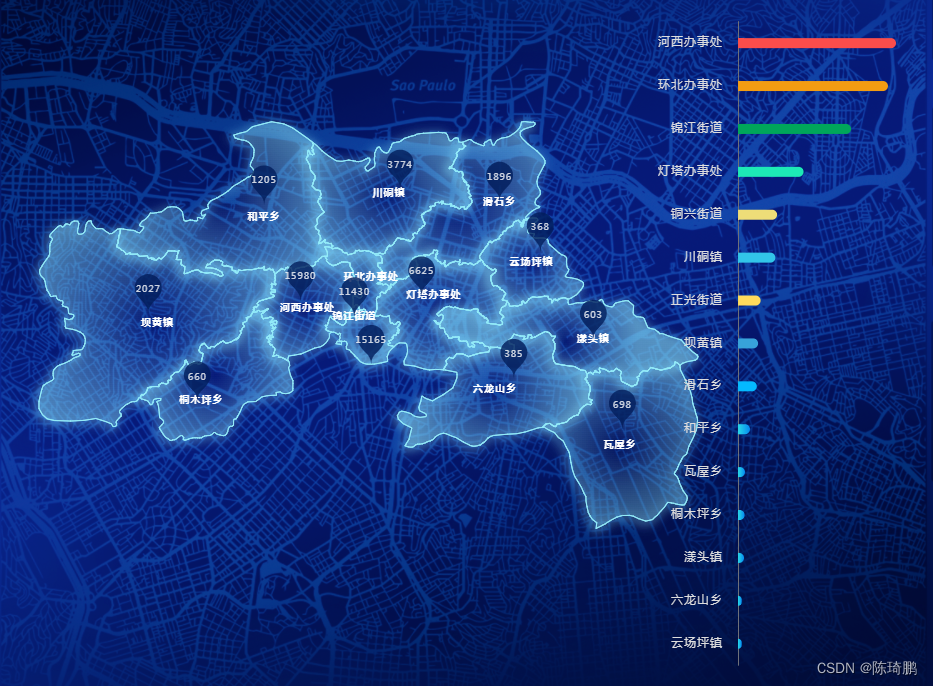
运行结果


 1315
1315

 被折叠的 条评论
为什么被折叠?
被折叠的 条评论
为什么被折叠?
 到【灌水乐园】发言


