


 本文介绍了如何使用Echarts库实现一个地图组件,根据后端返回的数据动态渲染省份、城市,并支持点击下钻到更详细的区县级别。通过axios请求数据,匹配并渲染地图,以及处理地图层级变化和颜色映射。
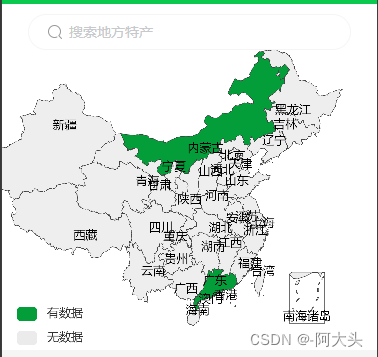
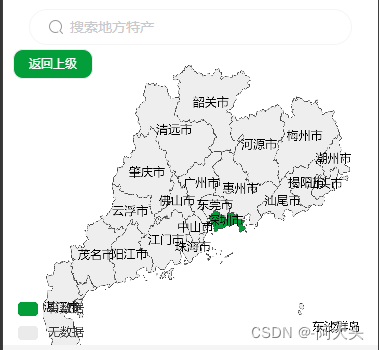
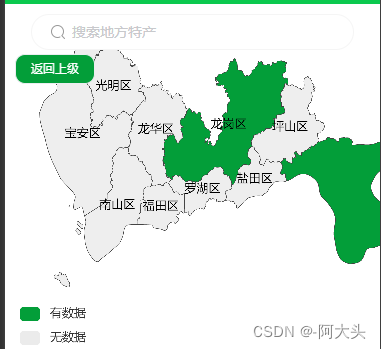
首先看一下实现的效果图,本项目的需求是根据后端返回的数据,哪些地图有数据的要给颜色,点击省份下钻到市,同样请求后端接口将有数据的城市渲染成绿色,区县也是一样的需求
首先npm安装echarts,这里就不说了
在页面引入
import * as echarts from "echarts"
import axios from "axios"
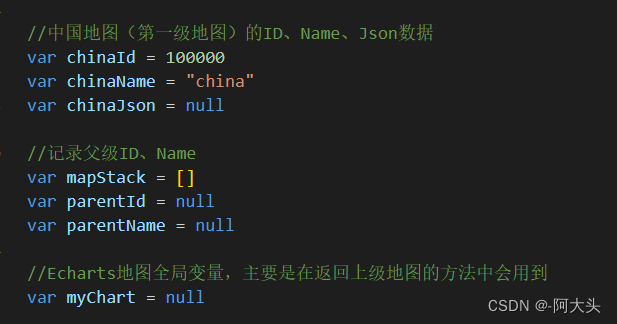
定义一些全局变量
接着在mounted中调用mapChart方法,该方法主要是先请求全国省级数据,然后初始化echarts地图

这里featuresList、chinaFeaturesList赋值是因为后端返回来的地区名称跟我本地的json数据的名称有出入,最终还是要以本地json数据的名称为主,所以拿后端返回区域编码跟本地的json数据匹配,找到对应的地区名称渲染地图
实现下钻的的思路就是点击省份的时候拿到省份的区域编码然后再请求本地对应编码的json数据,点击市级也是拿到市级编码请求本地的json数据回来渲染地图就行,至于说json数据的话,网上有,但是可能不全,我下载的json数据包就是漏了一些区县的数据,最后我是自己在这上面缺哪个下载哪个的
http://datav.aliyun.com/tools/atlas/#&lat=30.332329214580188&lng=106.72278672066881&zoom=3.5
下面是实现地图下钻的全部代码,我项目里是封装成组件了
<template>
  <div class="box">
    <van-button class="backBtn" @click="back()" v-if="regionCode !== 1"
      >返回上级</van-button
    >
    <div id="mapChart" class="chart"></div>
  </div>
</template>
<script>
import { getSupRegionAPi } from "@/utils/api"
import cityMap from "@/assets/mapjs/china-main-city-map.js"
import * as echarts from "echarts"
import axios from "axios"

//中国地图(第一级地图)的ID、Name、Json数据
var chinaId = 100000
var chinaName = "china"
var chinaJson = null

//记录父级ID、Name
var mapStack = []
var parentId = null
var parentName = null

//Echarts地图全局变量,主要是在返回上级地图的方法中会用到
var myChart = null

export default {
  name: "chinaMap",
  data() {
    return {
      regionCode: 1, // 区域编码,1代表全国
      supRegionList: [],
      featuresList: [], //根据点击实时保存当前数据
      chinaFeaturesList: [], //缓存省级数据
      cityId: null,
      center: [108.948024, 34.263161], //省级默认陕西的经纬度作为地图中心点,是市区则json数据的第一位作为地图中心点
    }
  },
  mounted() {
    //请求全国数据、初始化echarts地图
    this.mapChart("mapChart")
  },
  methods: {
    async getSupRegion(type) {
      try {
        this.supRegionList = []
        let params = {
          regionCode: this.regionCode,
        }
        const RES = await getSupRegionAPi(params)
        const { data, code } = RES.data
        if (code === 200) {
          data.forEach((item) => {
            if (!type) {
              this.featuresList.forEach((e) => {
                //后端请求回来的数据根据regionCode和echarts地图数据匹配获取到对应的名称
                //cityId有值说明是市区、区域编码为adcode,没有则说明是省编码为id
                if (!this.cityId) {
                  if (item.regionCode == e.id) {
                    item.name = e.properties.name
                    item.value = item.productTotal
                    this.supRegionList.push(item)
                  }
                } else {
                  if (item.regionCode == e.properties.adcode) {
                    item.name = e.properties.name
                    item.value = item.productTotal
                    this.supRegionList.push(item)
                  }
                }
              })
            } else {
              this.chinaFeaturesList.forEach((e) => {
                //后端请求回来的数据根据regionCode和echarts地图数据匹配获取到对应的名称
                if (item.regionCode == e.id) {
                  item.name = e.properties.name
                  item.value = item.productTotal
                  this.supRegionList.push(item)
                }
              })
            }
          })
        }
      } catch (err) {
        console.log("getSupRegionAPi接口异常捕获", err)
      }
    },
    back() {
      if (mapStack.length != 0) {
        //如果有上级目录则执行
        var map = mapStack.pop()
        axios
          .get("/mapjson/map/" + map.mapId + ".json", {})
          .then(async (response) => {
            const mapJson = response.data
            this.featuresList = mapJson.features
            this.regionCode = map.mapId === 100000 ? 1 : map.mapId

            if (map.mapId === 100000) {
              this.cityId = null
              this.center = [108.948024, 34.263161]
            } else {
              //判断中心点是否为数组(json数据包不规范,有些中心点是字符串)
              let center = this.featuresList[0].properties.center
              if (!Array.isArray(center)) {
                this.center = center.split(",")
              } else {
                this.center = center
              }
            }
            await this.getSupRegion()

            this.registerAndsetOption(
              myChart,
              map.mapId,
              map.mapName,
              mapJson,
              false
            )

            //返回上一级后,父级的ID、Name随之改变
            parentId = map.mapId
            parentName = map.mapName
          })
      }
    },

    mapChart(divid) {
      axios
        .get("/mapjson/map/" + chinaId + ".json", {})
        .then(async (response) => {
          let mapJson = response.data
          //保存查询到的省级数据,方便根据json数据id匹配后端的regionCode,获取到json数据中对应的名称
          this.featuresList = mapJson.features
          if (chinaId == 100000) {
            this.chinaFeaturesList = mapJson.features
          }
          chinaJson = mapJson

          //请求接口获取区域商品数量,渲染到地图上
          await this.getSupRegion()
          //初始化echarts地图
          this.initMap(divid, chinaId, chinaName, mapJson)
        })
    },
    initMap(divid, chinaId, chinaName, mapJson) {
      myChart = echarts.init(document.getElementById(divid))
      this.registerAndsetOption(myChart, chinaId, chinaName, mapJson, false)
      parentId = chinaId
      parentName = "china"
      myChart.on("click", async (param) => {
        this.regionCode = param.data?.regionCode
        this.cityId = cityMap[param.name]
        if (this.cityId) {
          //代表有下级地图
          axios
            .get("/mapjson/map/" + this.cityId + ".json", {})
            .then(async (response) => {
              const mapJson = response.data
              this.featuresList = mapJson.features
              this.$emit(
                "mapClick",
                this.featuresList,
                this.cityId,
                mapStack.length
              )
              //判断中心点是否为数组(json数据包不规范,有些中心点是字符串)
              let center = this.featuresList[0].properties.center
              if (!Array.isArray(center)) {
                this.center = center.split(",")
              } else {
                this.center = center
              }

              await this.getSupRegion()
              this.registerAndsetOption(
                myChart,
                this.cityId,
                param.name,
                mapJson,
                true
              )
            })
        } else {
          return

          //没有下级地图,回到一级中国地图,并将mapStack清空,中心点默认为陕西
          this.center = [108.948024, 34.263161]
          this.regionCode = 1
          this.$emit("mapClick", [], param.name, mapStack.length)
          await this.getSupRegion("china")

          this.registerAndsetOption(
            myChart,
            chinaId,
            chinaName,
            chinaJson,
            false
          )
          mapStack = []
          parentId = chinaId
          parentName = chinaName
        }
      })
    },
    /**
     *
     * @param {*} myChart
     * @param {*} id        省市县Id
     * @param {*} name      省市县名称
     * @param {*} mapJson   地图Json数据
     * @param {*} flag      是否往mapStack里添加parentId,parentName
     */
    registerAndsetOption(myChart, id, name, mapJson, flag) {
      echarts.registerMap(name, mapJson)
      myChart.setOption({
        visualMap: {
          // 左下角的颜色区域
          type: "piecewise", // 定义为分段型 continuous和piecewise
          min: 0,
          max: 1500,
          itemWidth: 20,
          bottom: 0,
          left: 10,
          pieces: [
            // 自定义『分段式视觉映射组件(visualMapPiecewise)』的每一段的范围,以及每一段的文字,以及每一段的特别的样式
            { gt: 0, lte: 10000, label: "有数据", color: "#039e39" },
            { value: 0, label: "无数据", color: "#ebebeb" },
          ],
        },

        geo: {
          // 地理坐标系组件用于地图的绘制
          map: name, // 表示中国地图
          type: "map",
          roam: true, // 是否开启鼠标缩放和平移漫游
          zoom: 1.2, // 当前视角的缩放比例(地图的放大比例)
          label: {
            show: true, //名称显示
          },
          center: this.center, //地图中心点经纬度坐标,roam:true时最好设置地图中心点,不然放大之后点击下钻地图不在页面上显示
        },
        series: [
          {
            name: "", // 浮动框的标题(上面的formatter自定义了提示框数据,所以这里可不写)
            type: "map",
            geoIndex: 0,
            label: {
              show: true,
            },
            // 这是需要配置地图上的某个地区的数据,根据后台的返回的数据进行渲染
            data: this.supRegionList,
          },
        ],
      })

      if (flag) {
        //往mapStack里添加parentId,parentName,返回上一级使用
        mapStack.push({
          mapId: parentId,
          mapName: parentName,
        })
        parentId = id
        parentName = name
      }
    },
    initMapData(mapJson) {
      var mapData = []
      for (var i = 0; i < mapJson.features.length; i++) {
        mapData.push({
          name: mapJson.features[i].properties.name,
        })
      }
      return mapData
    },
  },
}
</script>
<style lang="scss" scoped>
.box {
  width: 100%;
  height: 300px;
  background: #fff;
  position: relative;
  .backBtn {
    position: absolute;
    left: 10px;
    top: 4px;
    width: 80px;
    height: 30px;
    // background: #9ad8b0;
    background: #039e39;
    color: #fff;
    font-size: 12px;
    border-radius: 10px;
    z-index: 99;
  }
  .chart {
    width: 100%;
    height: 100%;
  }
}
</style>


 2206
2206

 被折叠的 条评论
为什么被折叠?
被折叠的 条评论
为什么被折叠?
 到【灌水乐园】发言


