


- ECharts:一个基于 JavaScript 的开源可视化图表库。
- resize:window的resize事件,在浏览器窗口大小发生变化时触发,利用该事件可以跟踪窗口大小的变化来动态调整页面的元素显示。。
- element-resize-detector:一个用于检测HTML元素尺寸变化的JavaScript库。
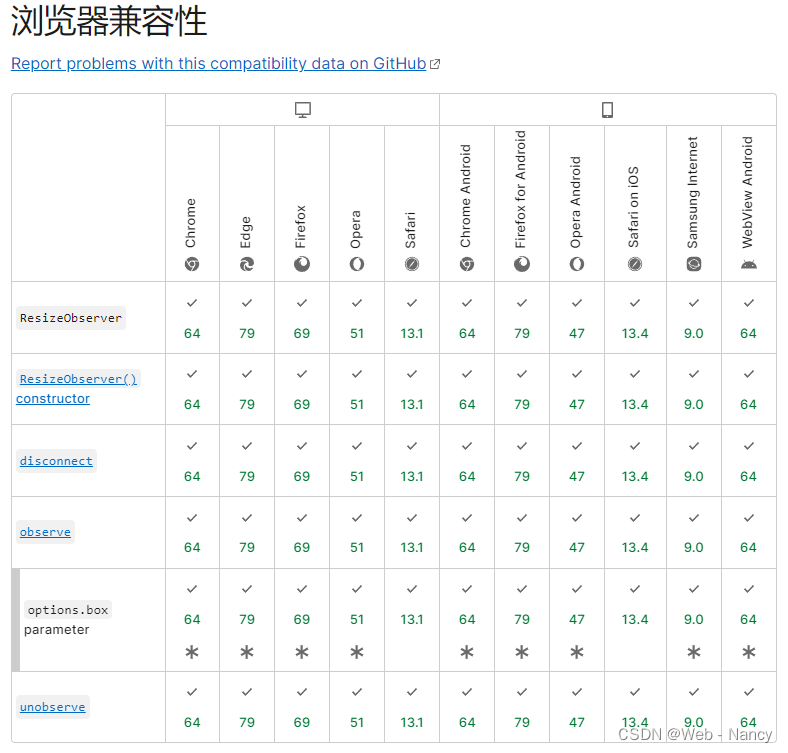
- ResizeObserver:一个使用接口监视 Element 内容盒或边框盒或者 SVGElement 边界尺寸的变化的WebApi.
目录
注:有局限性,只能监听页面变化,无法监听如菜单栏折叠的变化。
注: 谨慎使用,消耗资源,可能导致浏览器卡顿和兼容性的问题,影响性能并降低体验。
3.3、ResizeObserver(推荐) + resize
效果
一、介绍
1、官方文档
(1)Ant Design Vue
 https://1x.antdv.com/components/tree-cn#components-tree-demo-context-menu
(2)echarts
(3)element-resize-detector
(4)Resize Observer
Resize Observer API - Web API 接口参考 | MDN
二、准备工作
1、安装依赖包
npm install ant-design-vue --save

npm install echarts --save

npm install element-resize-detector --save
2、示例版本
"ant-design-vue": "^1.7.8",

"echarts": "^5.4.2",

"element-resize-detector": "^1.2.4",
三、使用步骤
1、ant-design-vue
1.1、在main.ts引入
import Vue from "vue";
import Antd from "ant-design-vue";
import "ant-design-vue/dist/antd.css";


Vue.use(Antd);
2、ecahrts
2.1、在单页面引入 ' echarts '
import * as echarts from "echarts";注:上面的代码会引入 ECharts 中所有的图表和组件,如果你不想引入所有组件,也可以使用 ECharts 提供的按需引入的接口来打包必须的组件。详见官方文档:在项目中引入 ECharts - 入门篇 - Handbook - Apache ECharts
2.2、指定容器并设置容器宽高
<template>
  <div class="chart" id="chart">
    <div id="main"></div>
  </div>
</template>

<script>
  import * as echarts from "echarts";
  export default {
    name: "echart",
    data() {
      return {

      };
    },
    methods: {
      initChart() {
        let data = this.data
        let chartDom = document.getElementById("main");
        this.chart = echarts.init(chartDom);
        let option;

        ...详见完整示例
      },
    },
  };
</script>

<style scoped>
  .chart {
    flex: 1;
    width: 100%;
    height: 300px;
    overflow: hidden;
  }

  #main {
    width: 100%;
    height: 100%;
  }
</style>
3、resize
3.1、window的resize事件
mounted() {
  // 1、获取需要监听尺寸变化的元素
  this.resizeDom = document.getElementById('chart');
  this.$nextTick(() => {
    this.initChart();
  }
  // 2、监听变化
  window.addEventListener('resize', this.resize);
},

beforeUnmount() {
  // 3、取消监听
  window.removeEventListener('resize', this.resize);
},

methods: {
  resize() {
    ...详见完整示例
  },
}
注:有局限性,只能监听页面变化,无法监听如菜单栏折叠的变化。
3.2、element-resize-detector
// 1、引入 element-resize-detector
import elementResizeDetector from 'element-resize-detector';

mounted() {
  // 2、获取需要监听尺寸变化的元素
  this.resizeDom = document.getElementById('chart');
  this.$nextTick(() => {
    this.initChart();
    // 3、创建一个 elementResizeDetector 实例:
    this.resizeEle = elementResizeDetector();
    // 4、传入需要监听的DOM元素
    this.resizeEle.listenTo(this.resizeDom, this.resize);
  }
},

beforeUnmount() {
  // 5、取消监听
  this.resizeEle.uninstall(this.resizeDom);
},

methods: {
  resize() {
    ...详见完整示例
  },
}
注: 谨慎使用,消耗资源,可能导致浏览器卡顿和兼容性的问题,影响性能并降低体验。
3.3、ResizeObserver(推荐) + resize
mounted() {
  // 1、获取需要监听尺寸变化的元素
  this.resizeDom = document.getElementById('chart');
  this.$nextTick(() => {
    this.initChart();
    // 2、创建一个 ResizeObserver 实例
    this.resizeEle = new ResizeObserver((entries) => {
      // fn
      this.resize();
    });
    // 3、传入需要监听的DOM元素
    this.resizeEle.observe(this.resizeDom);
  }
},

beforeUnmount() {
  // 4、取消监听
  // this.resizeEle.unobserve(this.resizeDom); // 4.1、取消监听某个DOM节点
  this.resizeEle.disconnect(this.resizeDom); // 4.2、取消对所有节点的监听
},

methods: {
  resize() {
    ...详见完整示例
  },
}
四、完整示例
1、main.ts
import Vue from "vue";
import Antd from "ant-design-vue";
import App from "./App.vue";
import router from "./router";
import store from "./store";
import "ant-design-vue/dist/antd.css";
Vue.config.productionTip = false;

Vue.use(Antd);

new Vue({
  router,
  store,
  render: (h) => h(App),
}).$mount("#app");
2、example.vue
2.1、windows的resize事件
<template>
  <div class="wrap" id="wrap">
    <div v-if="!toggleStatus" class="expand">
      <div class="title">
        <span>表格</span>
        <a-icon type="menu-fold" class="icons" @click="toggleStatus = !toggleStatus" />
      </div>
      <a-table :dataSource="dataSource" :columns="columns" />
    </div>
    <div v-else class="fold">
      <a-icon type="menu-unfold" class="icons" @click="toggleStatus = !toggleStatus" />
    </div>
    <div class="chart" id="chart">
      <div id="main"></div>
    </div>
  </div>
</template>

<script>
  import * as echarts from 'echarts';
  export default {
    name: 'echart',
    data() {
      return{
        option: null,
        toggleStatus: false,
        dataSource: [
          {
            key: '1',
            name: '胡彦斌',
            age: 32,
            address: '西湖区湖底公园1号',
          },
          {
            key: '2',
            name: '胡彦祖',
            age: 42,
            address: '西湖区湖底公园1号',
          },
        ],
        columns: [
          {
            title: '姓名',
            dataIndex: 'name',
            key: 'name',
          },
          {
            title: '年龄',
            dataIndex: 'age',
            key: 'age',
          },
          {
            title: '住址',
            dataIndex: 'address',
            key: 'address',
          },
        ],
        resizeDom: null,
        chart: null,
        drawTiming: null,
        resizeEle: undefined,
      }
    },
    mounted() {
      // 1、获取需要监听尺寸变化的元素
      this.resizeDom = document.getElementById('chart');
      this.$nextTick(() => {
        this.initChart();
      }
      // 2、监听变化
      window.addEventListener('resize', this.resize);
    },
    beforeUnmount() {
      // 3、取消监听
      window.removeEventListener('resize', this.resize);
      this.chart.dispose();
      this.chart = null;
      clearTimeout(this.drawTiming);
      this.drawTiming = null;
    },
    methods: {
      initChart() {
        let chartDom = document.getElementById('main');
        this.chart = echarts.init(chartDom);
        let option;

        option = {
          xAxis: {
            type: 'category',
            data: ['Mon', 'Tue', 'Wed', 'Thu', 'Fri', 'Sat', 'Sun']
          },
          yAxis: {
            type: 'value'
          },
          series: [
            {
              data: [150, 230, 224, 218, 135, 147, 260],
              type: 'line'
            }
          ]
        };

        let { clientWidth: width, clientHeight: height } = this.resizeDom;
        this.chart.resize({ width, height });
        option && this.chart.setOption(option, true); // 设置true清空echart缓存
      },
      resize() {
        clearTimeout(this.drawTiming);
        // 使用setTimeout,避免频繁地改变DOM节点的宽高,消耗性能
        this.drawTiming = setTimeout(() => {
          let { clientWidth: width, clientHeight: height } = this.resizeDom;
          this.chart.resize({ width, height });
        }, 200);
      },
    }
  }
</script>

<style lang="less" scoped>
  .wrap {
    width: 100%;
    height: 100%;
    padding: 1rem;
    display: flex;
  }
  .expand {
    width: 30%;
  }
  .title {
    margin-bottom: 0.5rem;
    display: flex;
    align-items: center;
    justify-content: space-between;
  }
  .fold {
    width: 5%;
  }
  .chart {
    flex: 1;
    width: 100%;
    height: 300px;
    overflow: hidden;
  }
  #main {
    width: 100%;
    height: 100%;
  }
  .icons:hover {
    color: #42b983;
  }
</style>
2.2、element-resize-detector
<template>
  <div class="wrap" id="wrap">
    <div v-if="!toggleStatus" class="expand">
      <div class="title">
        <span>表格</span>
        <a-icon type="menu-fold" class="icons" @click="toggleStatus = !toggleStatus" />
      </div>
      <a-table :dataSource="dataSource" :columns="columns" />
    </div>
    <div v-else class="fold">
      <a-icon type="menu-unfold" class="icons" @click="toggleStatus = !toggleStatus" />
    </div>
    <div class="chart" id="chart">
      <div id="main"></div>
    </div>
  </div>
</template>

<script>
  import * as echarts from 'echarts';
  // 1、引入 element-resize-detector:
  import elementResizeDetector from 'element-resize-detector';
  export default {
    name: 'echart',
    data() {
      return{
        option: null,
        toggleStatus: false,
        dataSource: [
          {
            key: '1',
            name: '胡彦斌',
            age: 32,
            address: '西湖区湖底公园1号',
          },
          {
            key: '2',
            name: '胡彦祖',
            age: 42,
            address: '西湖区湖底公园1号',
          },
        ],
        columns: [
          {
            title: '姓名',
            dataIndex: 'name',
            key: 'name',
          },
          {
            title: '年龄',
            dataIndex: 'age',
            key: 'age',
          },
          {
            title: '住址',
            dataIndex: 'address',
            key: 'address',
          },
        ],
        resizeDom: null,
        chart: null,
        drawTiming: null,
        resizeEle: undefined,
      }
    },
    mounted() {
      // 2、获取需要监听尺寸变化的元素
      this.resizeDom = document.getElementById('chart');
      this.$nextTick(() => {
        this.initChart();
        // 3、创建一个 elementResizeDetector 实例:
        this.resizeEle = elementResizeDetector();
        // 4、传入需要监听的DOM元素
        this.resizeEle.listenTo(this.resizeDom, this.resize);
      }
    },
    beforeUnmount() {
      // 5、取消监听
      this.resizeEle.uninstall(this.resizeDom);
      this.chart.dispose();
      this.chart = null;
      clearTimeout(this.drawTiming);
      this.drawTiming = null;
    },
    methods: {
      initChart() {
        let chartDom = document.getElementById('main');
        this.chart = echarts.init(chartDom);
        let option;

        option = {
          xAxis: {
            type: 'category',
            data: ['Mon', 'Tue', 'Wed', 'Thu', 'Fri', 'Sat', 'Sun']
          },
          yAxis: {
            type: 'value'
          },
          series: [
            {
              data: [150, 230, 224, 218, 135, 147, 260],
              type: 'line'
            }
          ]
        };

        let { clientWidth: width, clientHeight: height } = this.resizeDom;
        this.chart.resize({ width, height });
        option && this.chart.setOption(option, true); // 设置true清空echart缓存
      },
      resize() {
        clearTimeout(this.drawTiming);
        // 使用setTimeout,避免频繁地改变DOM节点的宽高,消耗性能
        this.drawTiming = setTimeout(() => {
          let { clientWidth: width, clientHeight: height } = this.resizeDom;
          this.chart.resize({ width, height });
        }, 200);
      },
    }
  }
</script>

<style lang="less" scoped>
  .wrap {
    width: 100%;
    height: 100%;
    padding: 1rem;
    display: flex;
  }
  .expand {
    width: 30%;
  }
  .title {
    margin-bottom: 0.5rem;
    display: flex;
    align-items: center;
    justify-content: space-between;
  }
  .fold {
    width: 5%;
  }
  .chart {
    flex: 1;
    width: 100%;
    height: 300px;
    overflow: hidden;
  }
  #main {
    width: 100%;
    height: 100%;
  }
  .icons:hover {
    color: #42b983;
  }
</style>
2.3、ResizeObserver + resize
<template>
  <div class="wrap" id="wrap">
    <div v-if="!toggleStatus" class="expand">
      <div class="title">
        <span>表格</span>
        <a-icon type="menu-fold" class="icons" @click="toggleStatus = !toggleStatus" />
      </div>
      <a-table :dataSource="dataSource" :columns="columns" />
    </div>
    <div v-else class="fold">
      <a-icon type="menu-unfold" class="icons" @click="toggleStatus = !toggleStatus" />
    </div>
    <div class="chart" id="chart">
      <div id="main"></div>
    </div>
  </div>
</template>

<script>
  import * as echarts from 'echarts';
  export default {
    name: 'echart',
    data() {
      return{
        option: null,
        toggleStatus: false,
        dataSource: [
          {
            key: '1',
            name: '胡彦斌',
            age: 32,
            address: '西湖区湖底公园1号',
          },
          {
            key: '2',
            name: '胡彦祖',
            age: 42,
            address: '西湖区湖底公园1号',
          },
        ],
        columns: [
          {
            title: '姓名',
            dataIndex: 'name',
            key: 'name',
          },
          {
            title: '年龄',
            dataIndex: 'age',
            key: 'age',
          },
          {
            title: '住址',
            dataIndex: 'address',
            key: 'address',
          },
        ],
        resizeDom: null,
        chart: null,
        drawTiming: null,
        resizeEle: undefined,
      }
    },
    mounted() {
      // 1、获取需要监听尺寸变化的元素
      this.resizeDom = document.getElementById('chart');
      this.$nextTick(() => {
        this.initChart();
         // 2、创建一个 ResizeObserver 实例
        this.resizeEle = new ResizeObserver((entries) => {
          // fn
          this.resize();
        });
        // 3、传入需要监听的DOM元素
        this.resizeEle.observe(this.resizeDom);
      }
    },
    beforeUnmount() {
      // 4、取消监听
      // this.resizeEle.unobserve(this.resizeDom); // 4.1、取消监听某个DOM节点
      this.resizeEle.disconnect(this.resizeDom); // 4.2、取消对所有节点的监听
      this.chart.dispose();
      this.chart = null;
      clearTimeout(this.drawTiming);
      this.drawTiming = null;
    },
    methods: {
      initChart() {
        let chartDom = document.getElementById('main');
        this.chart = echarts.init(chartDom);
        let option;

        option = {
          xAxis: {
            type: 'category',
            data: ['Mon', 'Tue', 'Wed', 'Thu', 'Fri', 'Sat', 'Sun']
          },
          yAxis: {
            type: 'value'
          },
          series: [
            {
              data: [150, 230, 224, 218, 135, 147, 260],
              type: 'line'
            }
          ]
        };

        let { clientWidth: width, clientHeight: height } = this.resizeDom;
        this.chart.resize({ width, height });
        option && this.chart.setOption(option, true); // 设置true清空echart缓存
      },
      resize() {
        clearTimeout(this.drawTiming);
        // 使用setTimeout,避免频繁地改变DOM节点的宽高,消耗性能
        this.drawTiming = setTimeout(() => {
          let { clientWidth: width, clientHeight: height } = this.resizeDom;
          this.chart.resize({ width, height });
        }, 200);
      },
    }
  }
</script>

<style lang="less" scoped>
  .wrap {
    width: 100%;
    height: 100%;
    padding: 1rem;
    display: flex;
  }
  .expand {
    width: 30%;
  }
  .title {
    margin-bottom: 0.5rem;
    display: flex;
    align-items: center;
    justify-content: space-between;
  }
  .fold {
    width: 5%;
  }
  .chart {
    flex: 1;
    width: 100%;
    height: 300px;
    overflow: hidden;
  }
  #main {
    width: 100%;
    height: 100%;
  }
  .icons:hover {
    color: #42b983;
  }
</style>
tips
1、如果只需要监听页面变化使用windows的resize事件即可;如果需要监听如菜单栏监听变化推荐使用ResizeObserver。
2、文中使用方法的更多API可阅读第一点的相关链接
欢迎扫描下方二维码关注VX公众号


 1883
1883

 被折叠的 条评论
为什么被折叠?
被折叠的 条评论
为什么被折叠?
 到【灌水乐园】发言


