


 本文详细指导了在 CentOS 7 上通过 NTP 同步时间,依次安装并配置 Elasticsearch、Kibana 和 Logstash,实现日志收集、存储与可视化的过程,包括JVM优化、索引管理以及 nginx 日志分析。
1. 实验环境
1.1 同步时间
1.1.1 安装ntpdate命令
yum -y install ntpdate
1.1.2 同步时间操作
ntpdate ntp.aliyun.com
1.2 虚拟机准备
操作系统均为centos7
规划:
elasticsearch 服务器: 192.168.153.183
kibana 服务器:192.168.153.184
logstash 服务器: 192.168.153.185
2. elasticsearch 安装及配置
elasticsearch服务器IP地址 192.168.153.183
elasticsearch 需要jdk环境
2.1 安装jdk
安装jdk
[root@localhost elk]# rpm -ivh jdk-8u131-linux-x64_.rpm
Preparing...                          ################################# [100%]
Updating / installing...
   1:jdk1.8.0_131-2000:1.8.0_131-fcs  ################################# [100%]
Unpacking JAR files...
	tools.jar...
	plugin.jar...
	javaws.jar...
	deploy.jar...
	rt.jar...
	jsse.jar...
	charsets.jar...
	localedata.jar...
[root@localhost elk]#

验证jdk安装成功
[root@localhost elk]# java -version
java version "1.8.0_131"
Java(TM) SE Runtime Environment (build 1.8.0_131-b11)
Java HotSpot(TM) 64-Bit Server VM (build 25.131-b11, mixed mode)
[root@localhost elk]#
2.2 安装elasticsearch
[root@localhost elk]# rpm -ivh elasticsearch-7.3.2-x86_64.rpm
warning: elasticsearch-7.3.2-x86_64.rpm: Header V4 RSA/SHA512 Signature, key ID d88e42b4: NOKEY
Preparing...                          ################################# [100%]
Updating / installing...
   elasticsearch-0:7.3.2-1          ################################# [100%]
### NOT starting on installation, please execute the following statements to configure elasticsearch service to start automatically using systemd
 sudo systemctl daemon-reload
 sudo systemctl enable elasticsearch.service
### You can start elasticsearch service by executing
 sudo systemctl start elasticsearch.service
Created elasticsearch keystore in /etc/elasticsearch
2.3 修改elasticsearch的配置文件
[root@localhost elk]# vim /etc/elasticsearch/elasticsearch.yml
17 cluster.name: my-application        # 集群名称
23 node.name: 192.168.153.183      #本节点名称
33 path.data: /var/lib/elasticsearch   #数据存储目录
37 path.logs: /var/log/elasticsearch  #日志存储目录
55 network.host: 0.0.0.0                   #本机器所有IP都可监听
59 http.port: 9200        					 #默认监听端口
68 discovery.seed_hosts: ["192.168.153.183"]    # 发现的主机
72 cluster.initial_master_nodes: ["192.168.153.183"]    #主节点名称,与上面23行的配置保持一致
2.4 配置JVM(可选)
jvm 运行内存不足时可修改
[root@localhost elk]# vim /etc/elasticsearch/jvm.options

 22 -Xms1g   为JVM启动时申请的最小内存
 23 -Xmx1g   为JVM可申请的最大内存
2.5 启动elasticsearch
[root@localhost elk]# systemctl start elasticsearch
2.6 查看端口验证elasticsearch是否启动成功
9200 为elasticsearch所监听的端口,9300 为集群节点之间通信的端口
[root@localhost elk]# netstat -nltp|grep java
tcp6       0      0 :::9200                 :::*                    LISTEN      8920/java
tcp6       0      0 :::9300                 :::*                    LISTEN      8920/java
[root@localhost elk]#
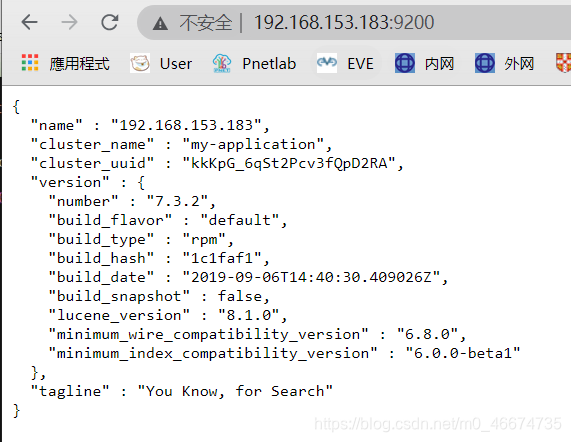
2.7 浏览器输入 IP:9200 验证
3. kibana 安装及配置
kibana服务器IP地址 192.168.153.184
3.1 安装kibana
[root@localhost ~]# rpm -ivh kibana-7.3.2-x86_64.rpm
warning: kibana-7.3.2-x86_64.rpm: Header V4 RSA/SHA512 Signature, key ID d88e42b4: NOKEY
Preparing...                          ################################# [100%]
Updating / installing...
   1:kibana-7.3.2-1                   ################################# [100%]
[root@localhost ~]#
3.2 修改kibana配置文件
[root@localhost ~]# vim /etc/kibana/kibana.yml
2 server.port: 5601                          # kibana默认监听的端口
7 server.host: "192.168.153.184"    # kibana 监听的IP地址
28 elasticsearch.hosts: ["http://192.168.153.183:9200"]    # elasticsearch 的地址和端口
114 i18n.locale: "zh-CN"   $设置kibana语言为中文
3.3 开启kibana服务
[root@localhost ~]# systemctl start kibana
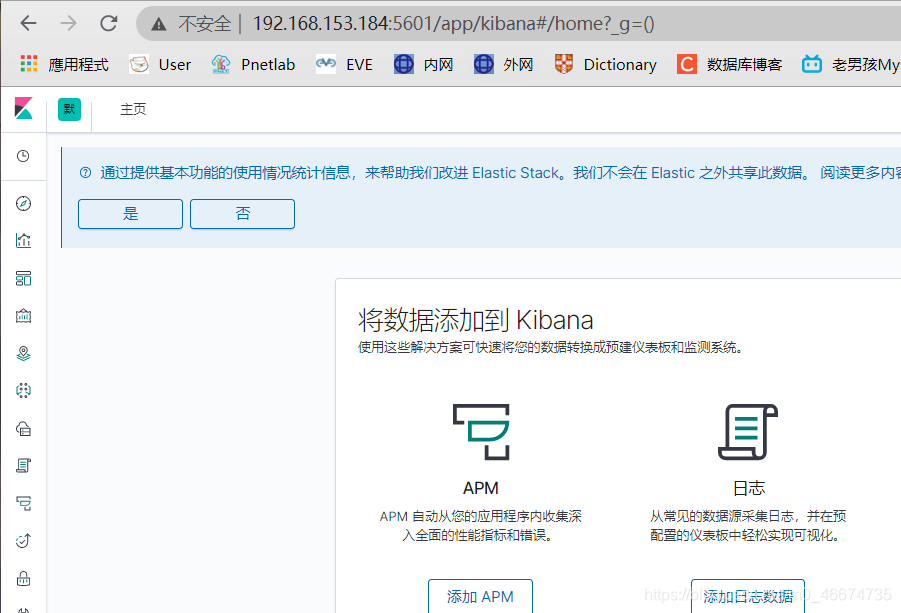
3.4 浏览器输入 IP:5601 查看
访问成功
4. logstash安装及配置
logstash服务器IP地址 192.168.153.185
4.1 安装jdk环境
[root@localhost ~]# rpm -ivh jdk-8u131-linux-x64_.rpm
Preparing...                          ################################# [100%]
Updating / installing...
   1:jdk1.8.0_131-2000:1.8.0_131-fcs  ################################# [100%]
Unpacking JAR files...
	tools.jar...
	plugin.jar...
	javaws.jar...
	deploy.jar...
	rt.jar...
	jsse.jar...
	charsets.jar...
	localedata.jar...
4.2 安装logstash
[root@localhost ~]# rpm -ivh logstash-7.3.2.rpm
warning: logstash-7.3.2.rpm: Header V4 RSA/SHA512 Signature, key ID d88e42b4: NOKEY
Preparing...                          ################################# [100%]
Updating / installing...
   1:logstash-1:7.3.2-1               ################################# [100%]
Using provided startup.options file: /etc/logstash/startup.options
/usr/share/logstash/vendor/bundle/jruby/2.5.0/gems/pleaserun-0.0.30/lib/pleaserun/platform/base.rb:112: warning: constant ::Fixnum is deprecated
Successfully created system startup script for Logstash
4.3 logstash配置文件的位置为
/etc/logstash/logstash.yml
无需修改
4.4 切换 /etc/logstash/conf.d/ 目录下,编写以.conf结尾的配置文件
以分析 /var/log/messages 为例
先给 /var/log/messages 增加读的权限
[root@localhost ~]# chmod +r /var/log/messages

查看效果
[root@localhost ~]# ll /var/log/messages
-rw-r--r--. 1 root root 136170 Jan  1 12:09 /var/log/messages
再编写conf配置文件
[root@localhost ~]# cd /etc/logstash/conf.d/
[root@localhost conf.d]# ls
system.conf
[root@localhost conf.d]# cat system.conf
input{
  file {
    path => "/var/log/messages"
    type => "system-log"
	start_position => "beginning"
  }

}

output{
	elasticsearch {
	  hosts => "192.168.153.183:9200"  #elasticsearch服务器的IP地址及端口号
	  index => "system-log_%{+YYYY.MM.dd}"
	}
}
4.5 编写 4.4 文件之后开启logstash服务
[root@localhost conf.d]# systemctl start logstash
4.6 查看是否有logstash的日志文件生成
[root@localhost conf.d]# watch ls /var/log/logstash/
Every 2.0s: ls /var/log/logstash/                                                Thu Dec 31 11:37:54 2020

logstash-plain.log
logstash-slowlog-plain.log
有日志文件生成时按 Ctrl+c 退出
4.7 追踪查看日志是否报错
[root@localhost conf.d]# tailf /var/log/logstash/logstash-plain.log
[2020-12-31T09:34:09,320][WARN ][org.logstash.instrument.metrics.gauge.LazyDelegatingGauge] A gauge metric of an unknown type (org.jruby.specialized.RubyArrayOneObject) has been create for key: cluster_uuids. This may result in invalid serialization.  It is recommended to log an issue to the responsible developer/development team.
[2020-12-31T09:34:09,332][INFO ][logstash.javapipeline    ] Starting pipeline {:pipeline_id=>"main", "pipeline.workers"=>4, "pipeline.batch.size"=>125, "pipeline.batch.delay"=>50, "pipeline.max_inflight"=>500, :thread=>"#<Thread:0x51a494ea run>"}
[2020-12-31T09:34:09,337][INFO ][logstash.outputs.elasticsearch] Attempting to install template {:manage_
.......
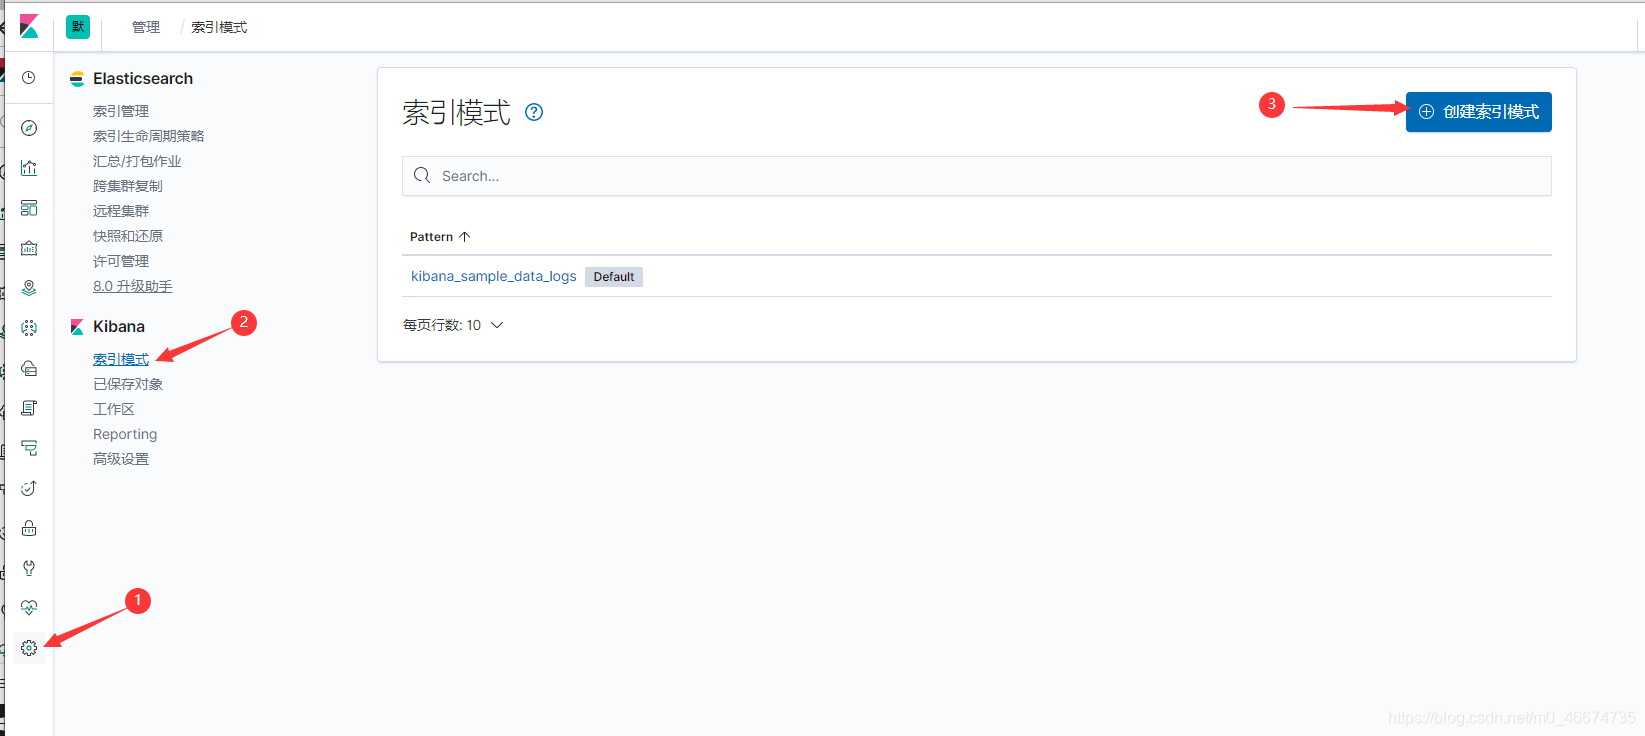
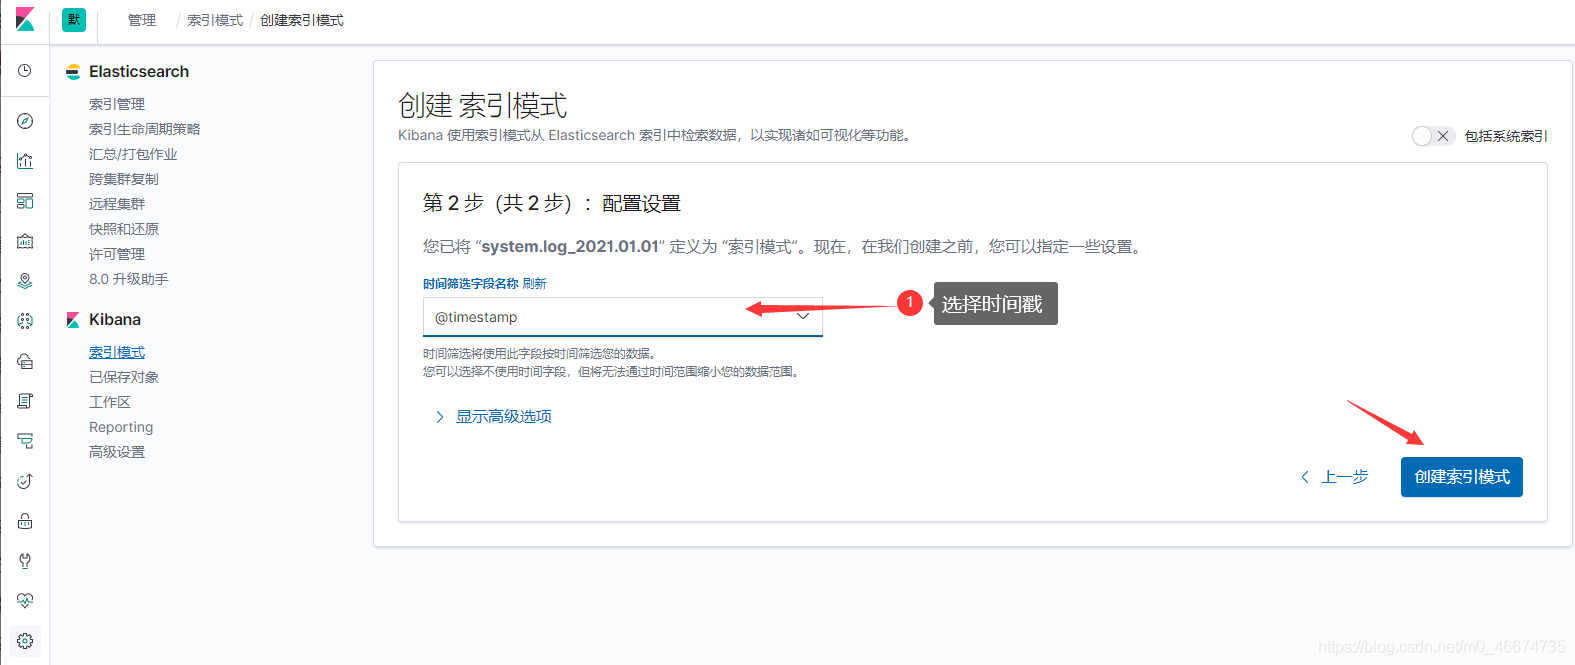
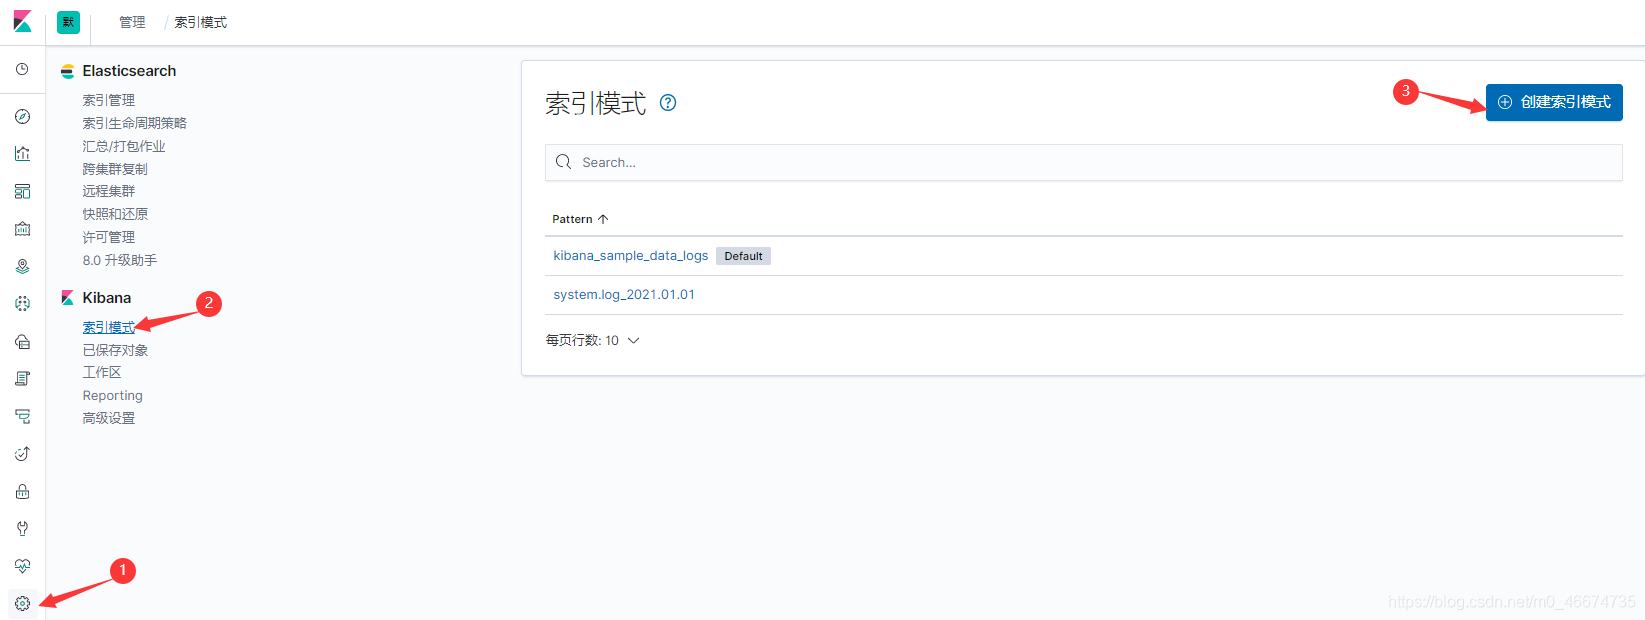
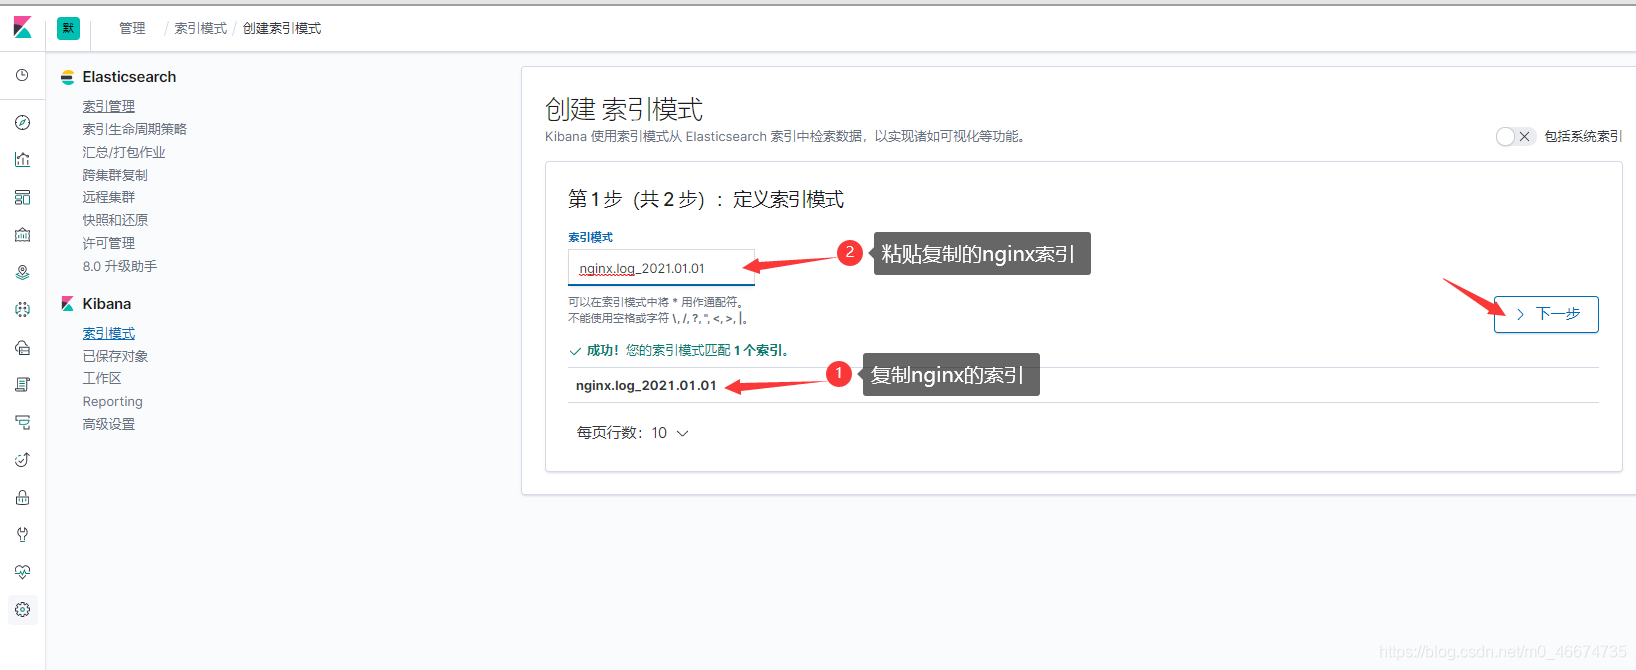
5. kibana 添加索引模式
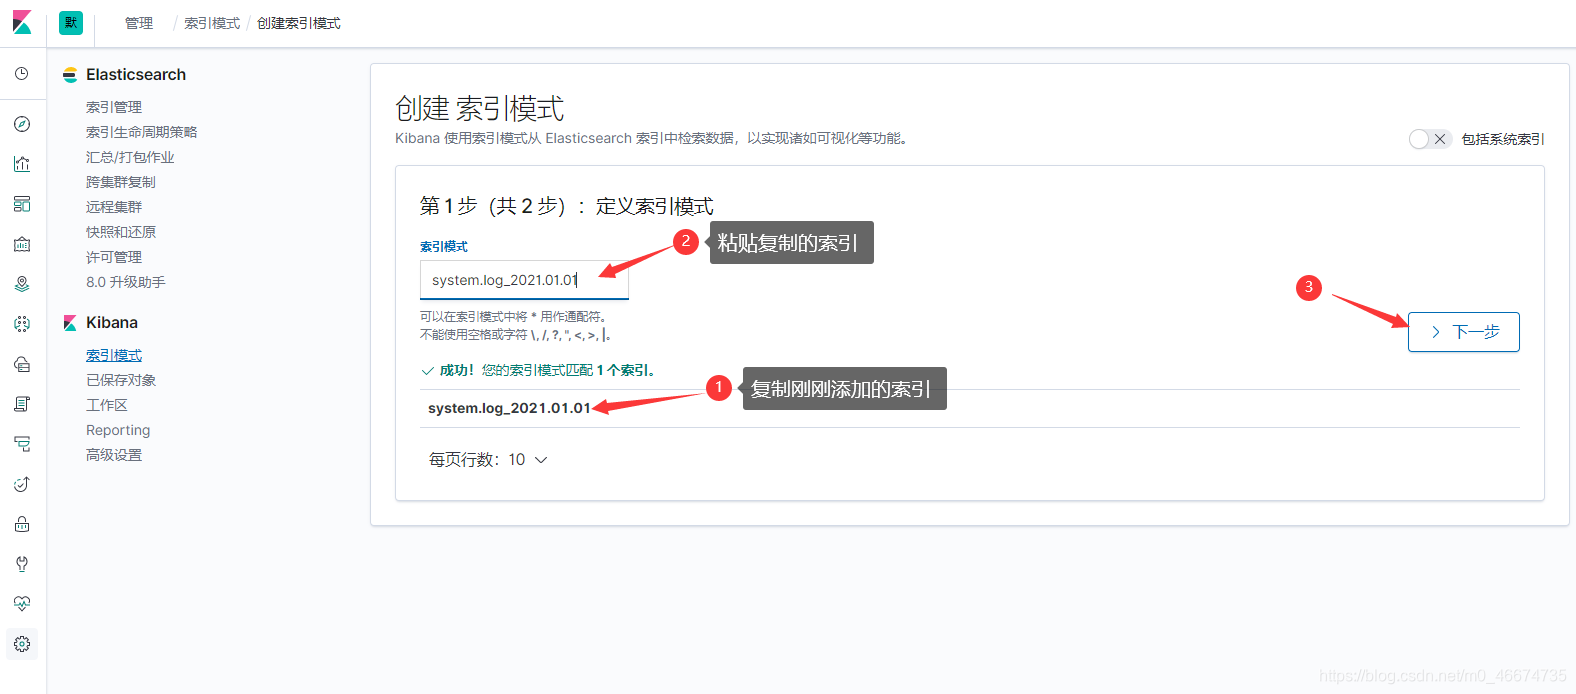
5.1
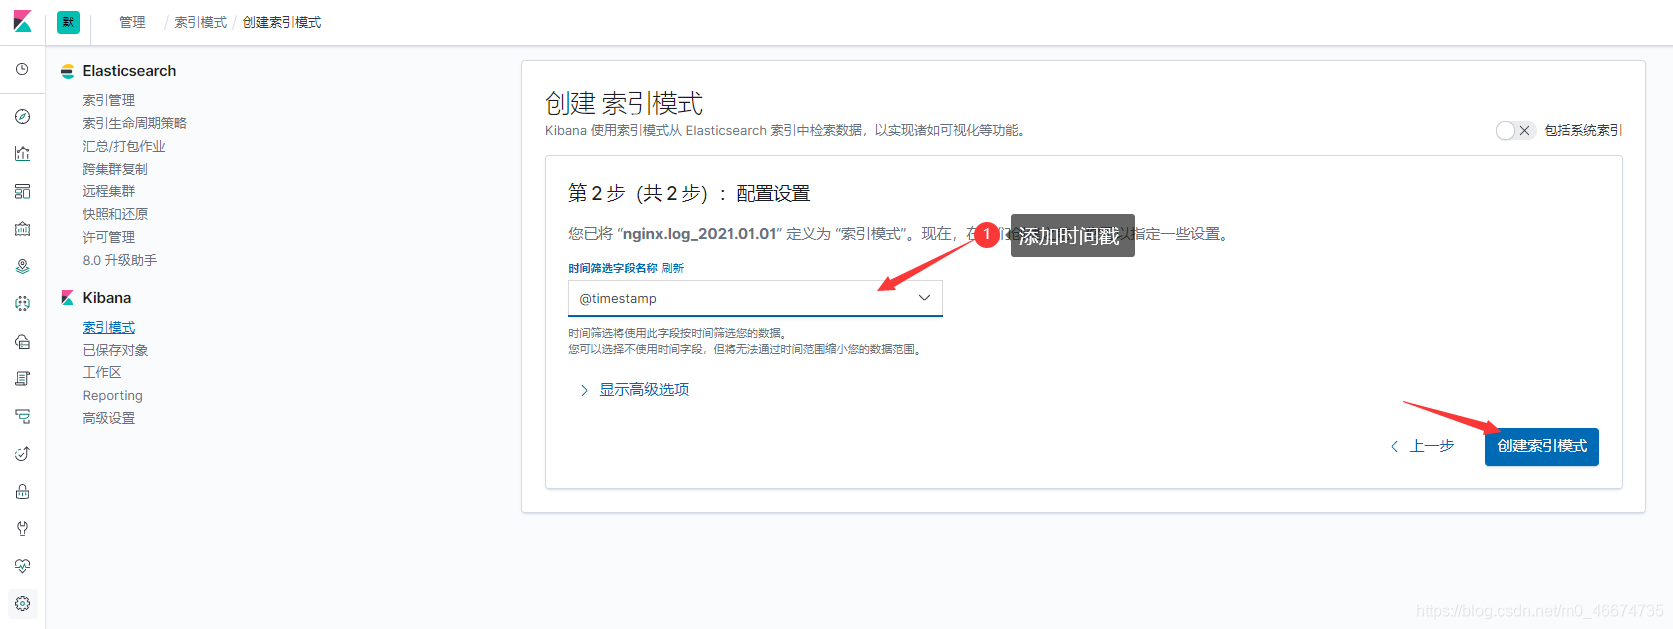
5.2
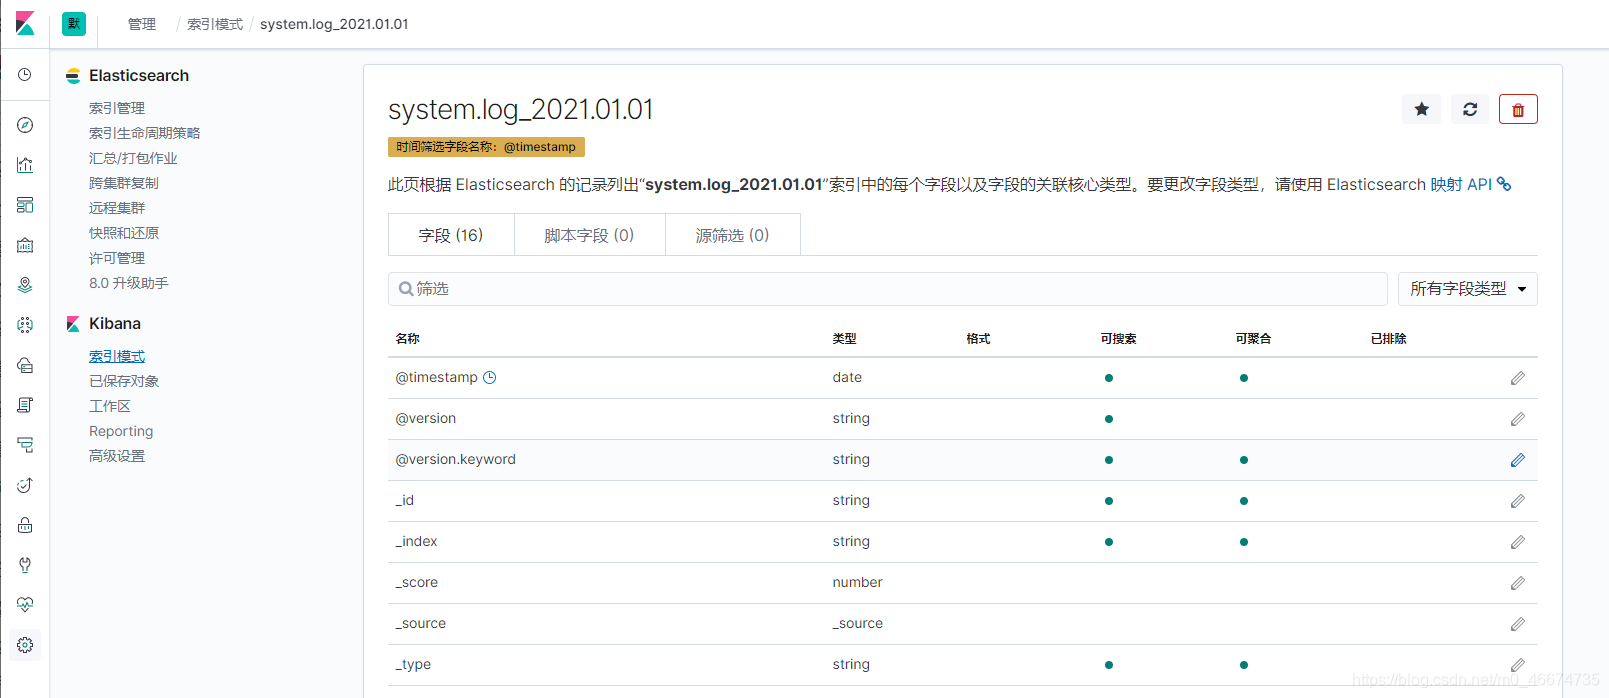
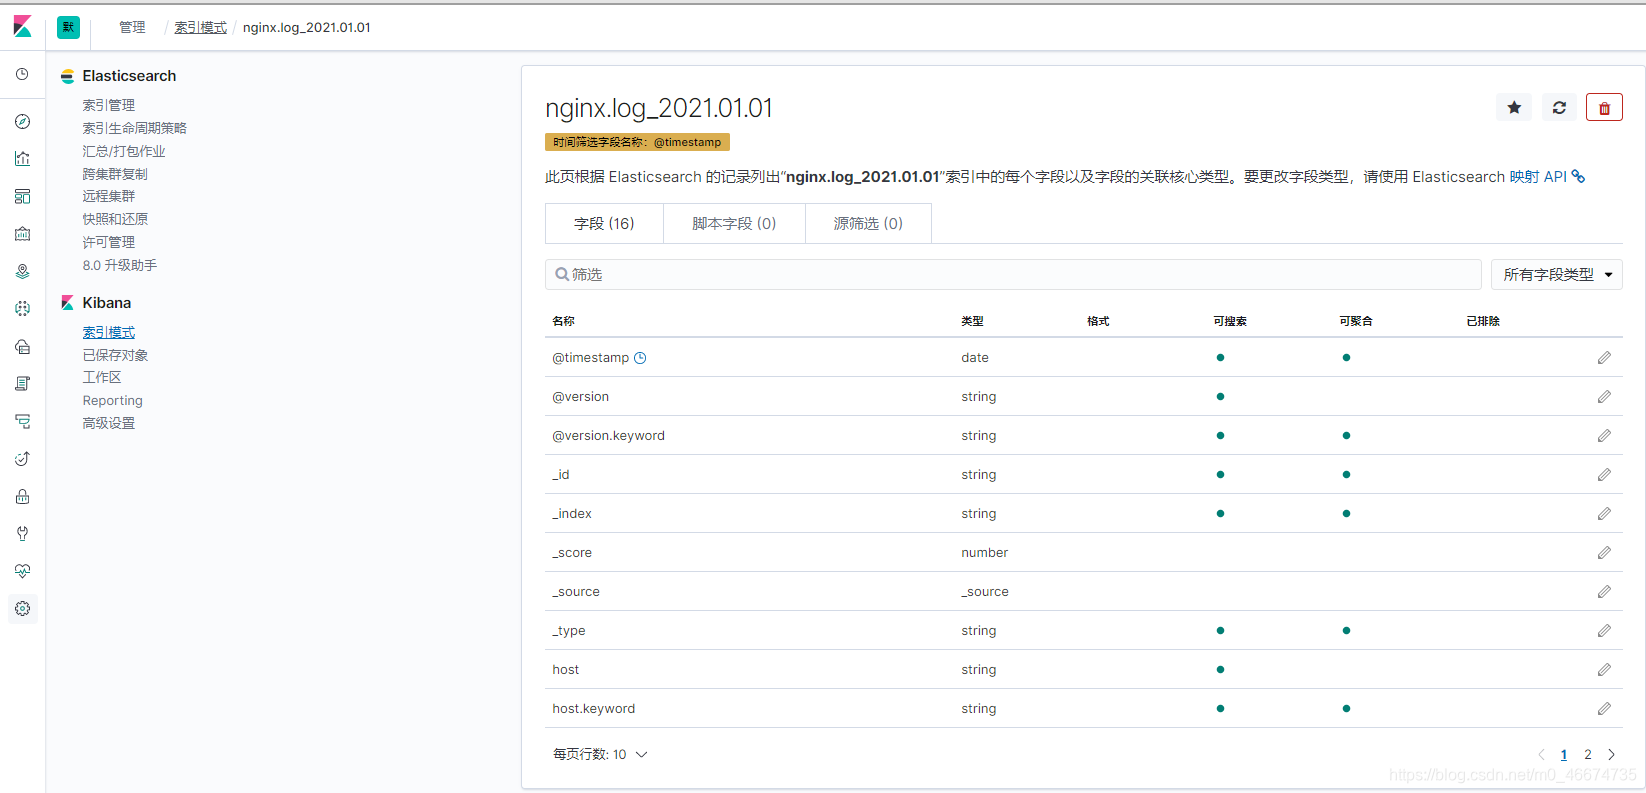
5.3
5.4 创建成功
5.5
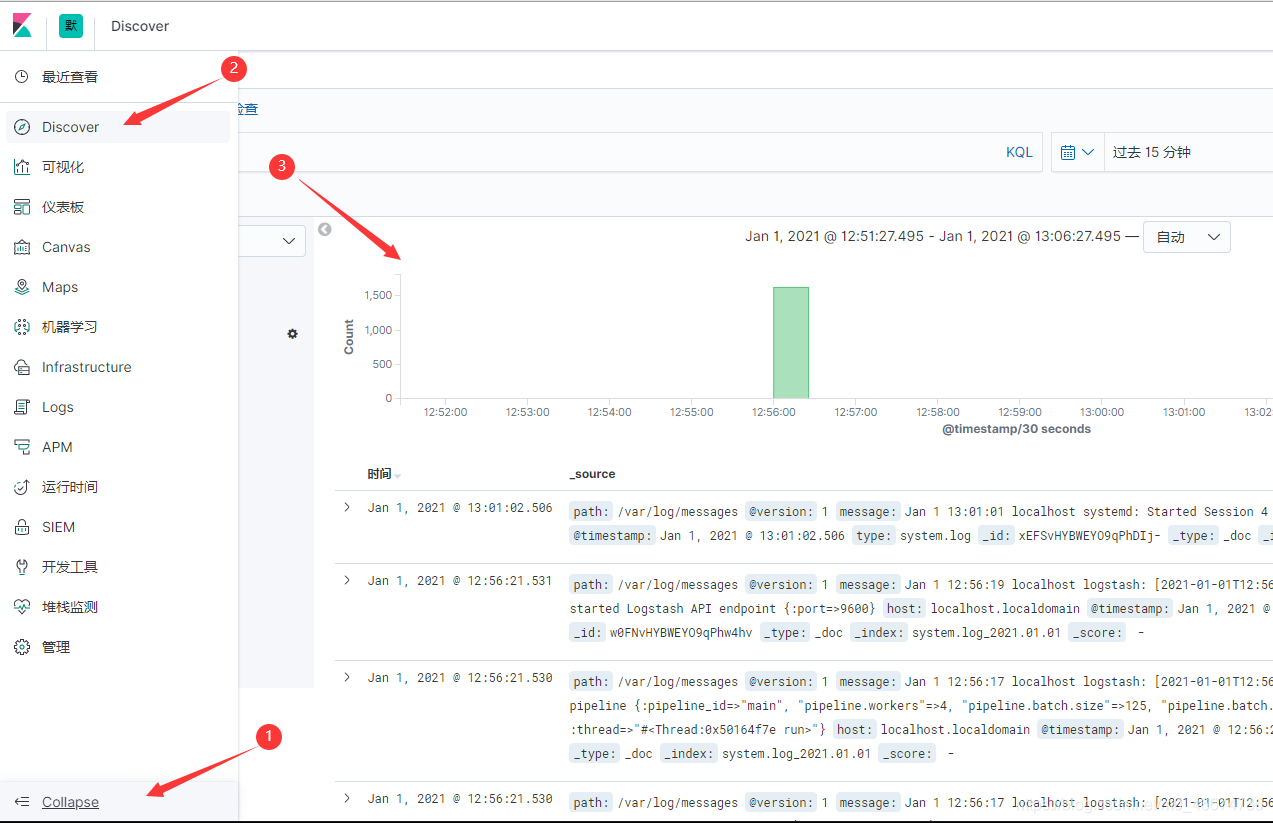
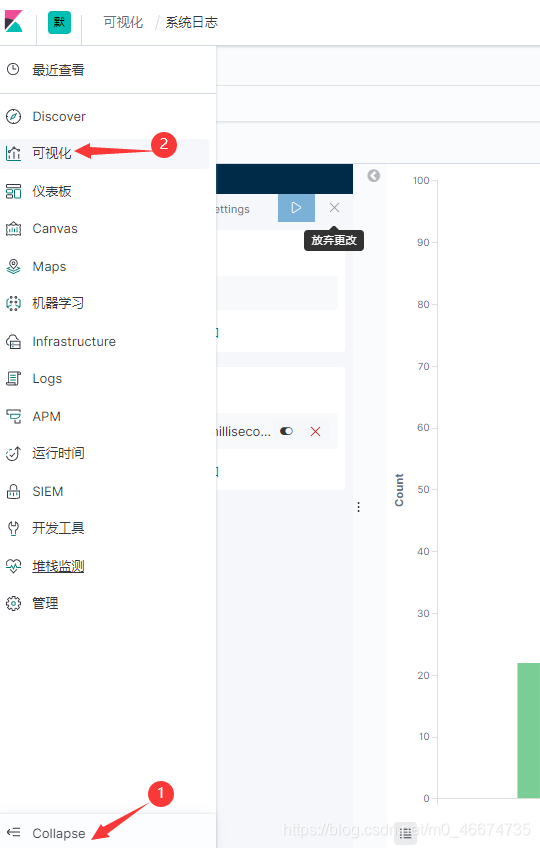
5.5 可视化的创建
1)
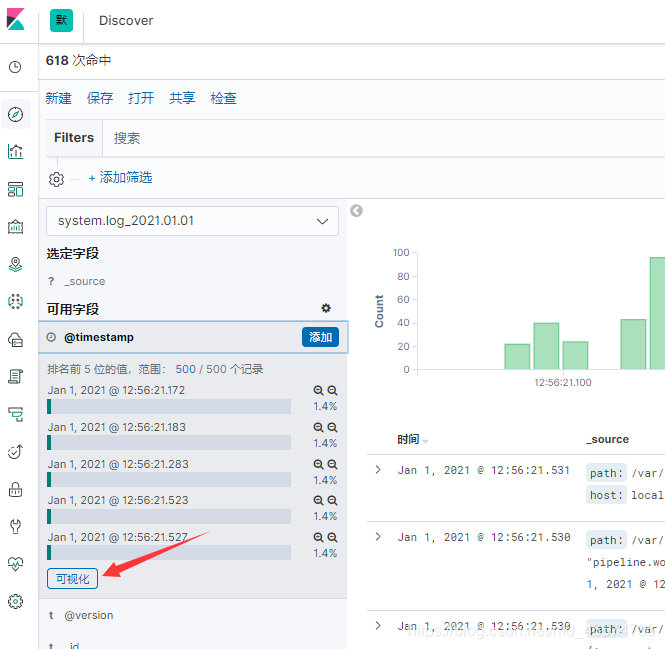
2)

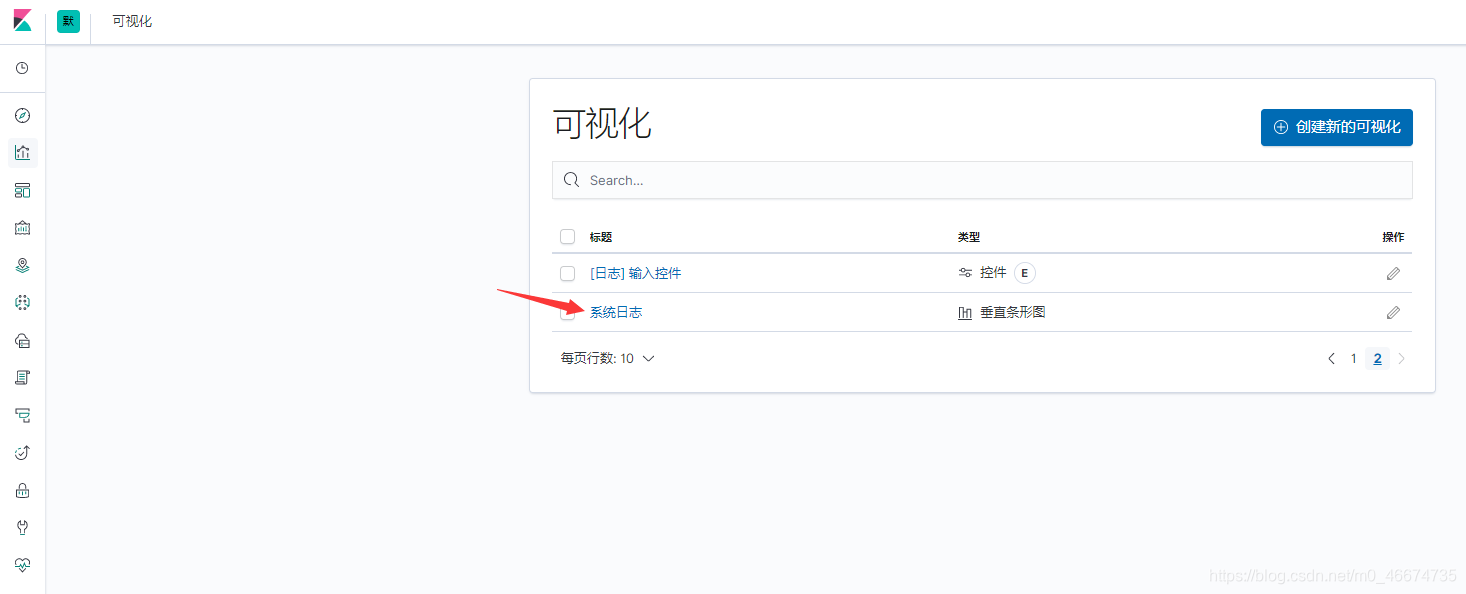
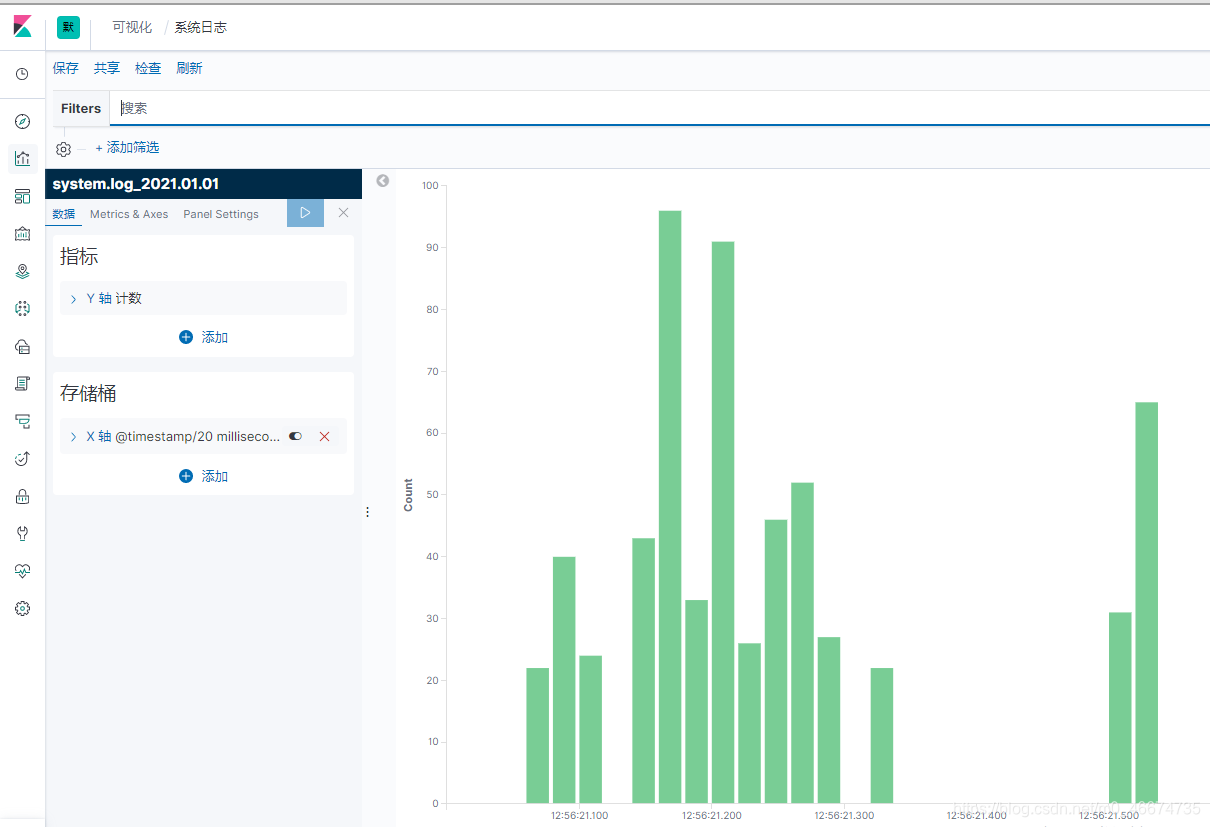
3)查看创建的可视化
6.分析nginx日志
6.1 在logstash服务器上源码安装nginx
安装链接>> https://blog.youkuaiyun.com/m0_46674735/article/details/111125960
6.2 在/etc/logstash/conf.d/ 目录下,编写以.conf结尾的配置文件,同时分析系统日志和nginx日志
[root@localhost ~]# cd /etc/logstash/conf.d/
[root@localhost conf.d]# vim system_nginx.conf
input {
  file {
    path => "/var/log/messages"
    type => "system.log"
    start_position => "beginning"
  }
  file {
    path => "/usr/local/nginx/logs/*.log"
    type => "nginx.log"
    start_position => "beginning"
  }
}

output {
  if [type] == "system.log" {
        elasticsearch {
          hosts => "192.168.153.183:9200"
          index => "system.log_%{+YYYY.MM.dd}"
        }
     }
  if [type] == "nginx.log" {
        elasticsearch {
          hosts => "192.168.153.183:9200"
          index => "nginx.log_%{+YYYY.MM.dd}"
        }
     }
}
6.3 编写完成conf文件后重启logstash服务
[root@localhost conf.d]# systemctl restart logstash
6.4 在kibana添加索引
1)
2)
3)
4)添加成功
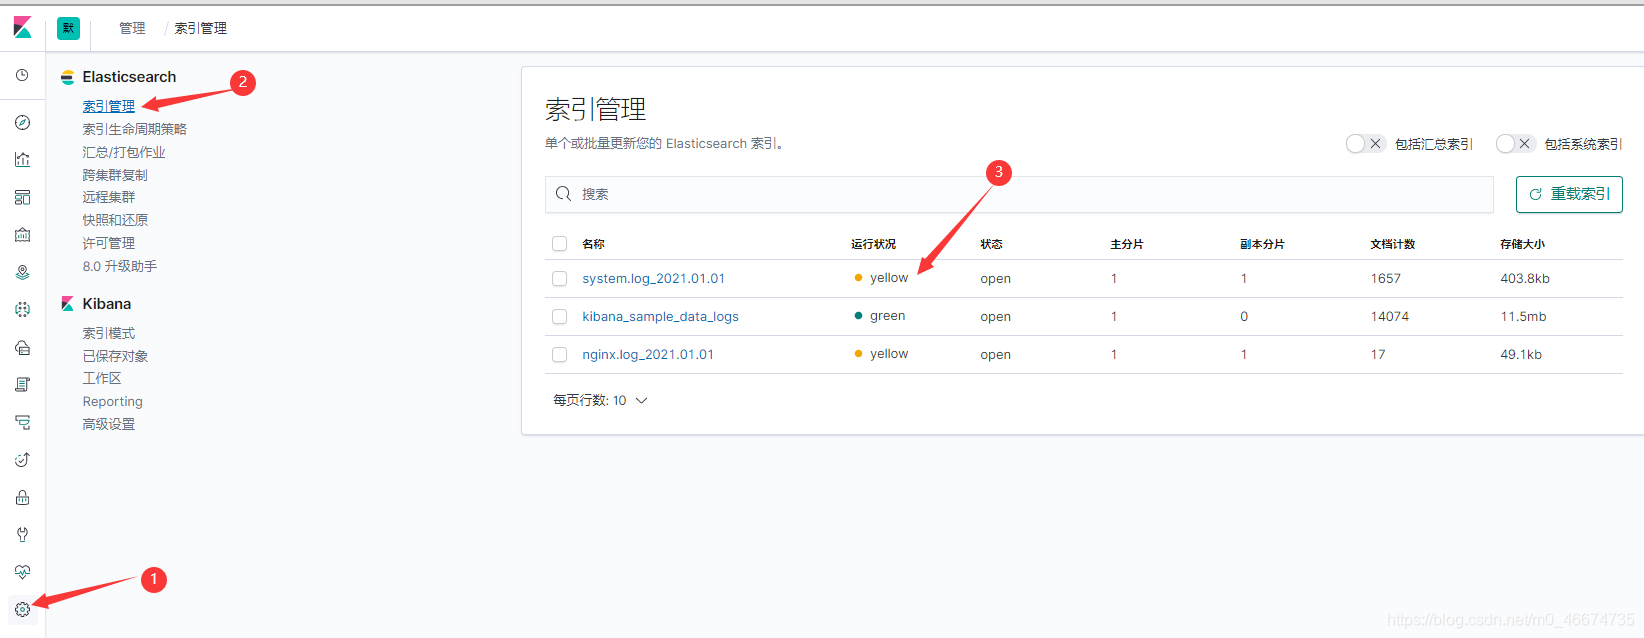
5)查看添加的nginx索引
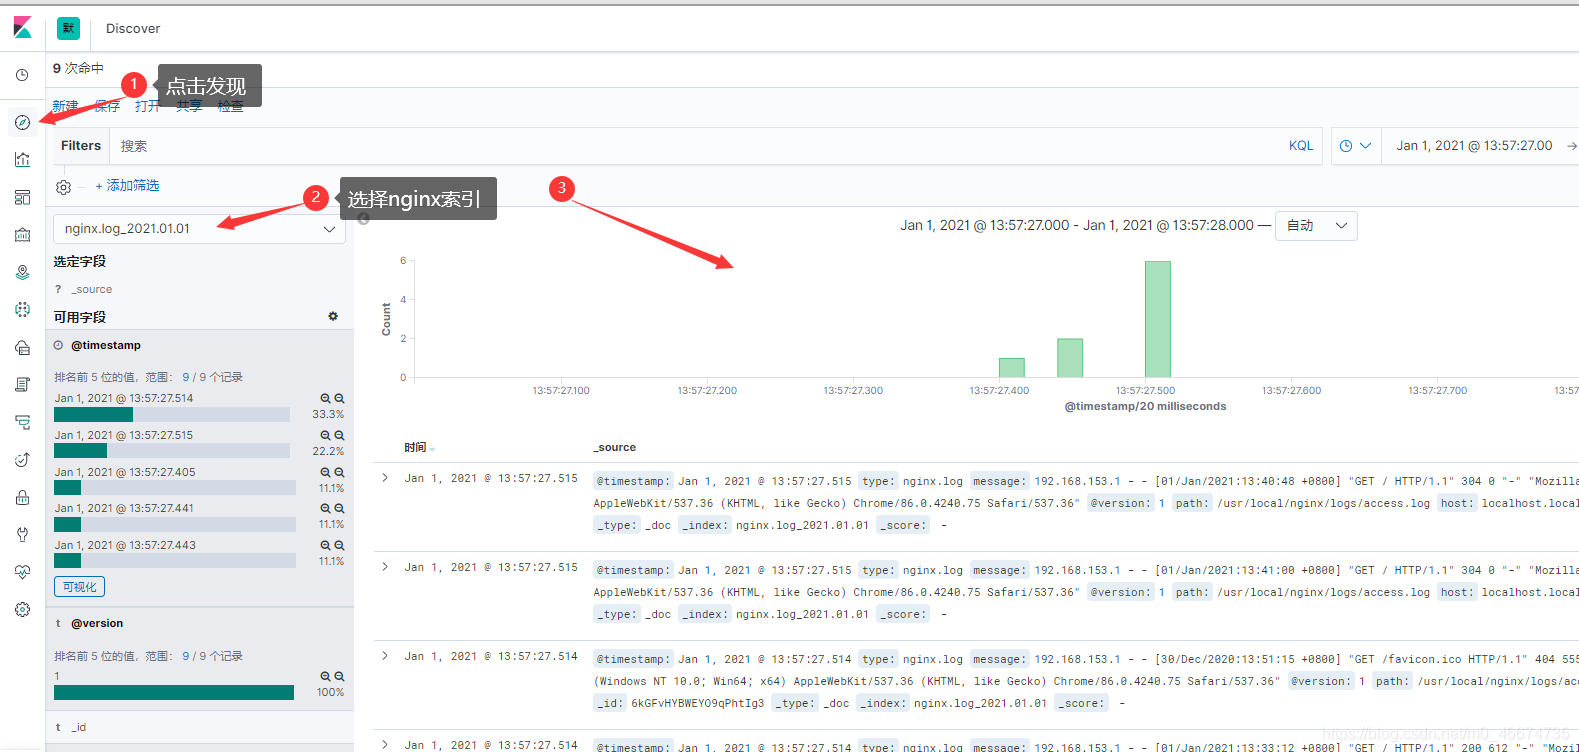
6.5 索引运行状态颜色为yellow的原因
只有一台机器,却设置了索引副本,这样索引的副本没有办法分配,因此就是 yellow 状态


 461
461

 被折叠的 条评论
为什么被折叠?
被折叠的 条评论
为什么被折叠?
 到【灌水乐园】发言


