


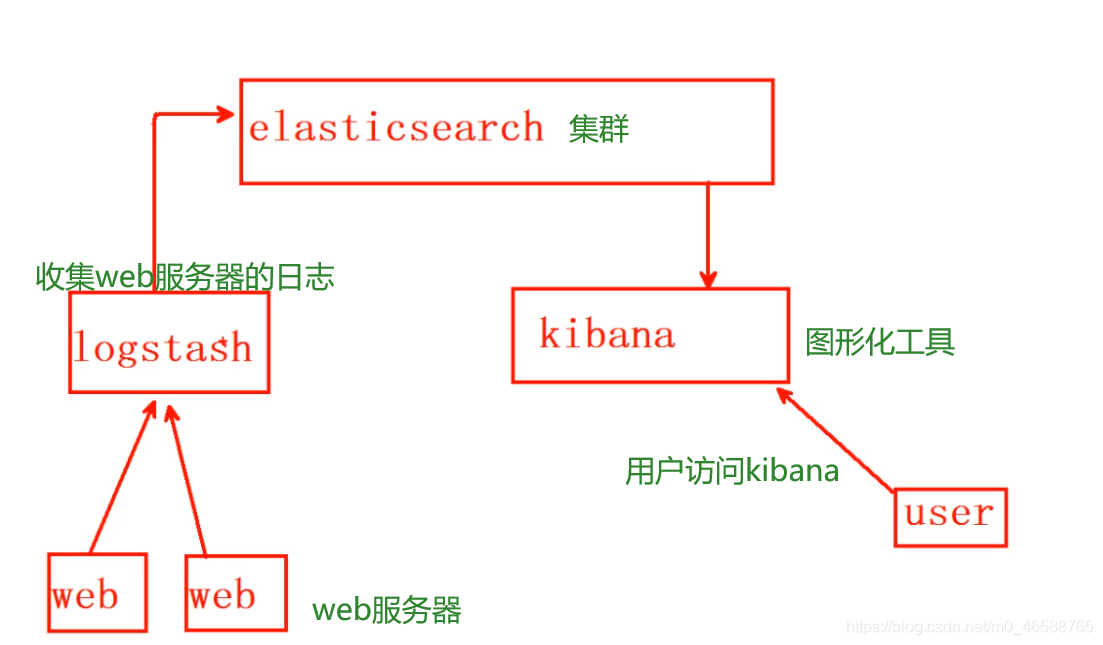
ELK是一整套解决方案
日志分析平台,是三个软件产品的首字母缩写,ELK分别代表:
- Elasticsearch:负责日志检索和储存
- Logstash:负责日志的收集和分析、处理
- Kibana:负责日志的可视化,提供图形化界面,实时总结流量和数据的图表。
ELk的架构:
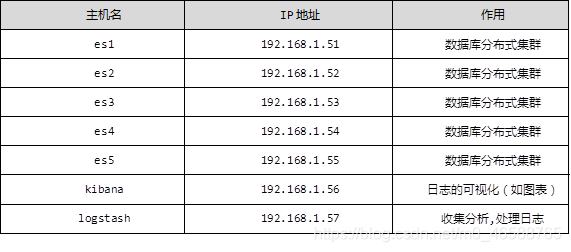
准备环境:
一: ES集群安装
安装一台ES服务器(其他4台数据库服务器操作一致):
- 需要自定义yum源 普通光盘镜像里没有elk的软件包(利用ftp服务共享软件包)
- 因为elasticsearch是java开发的,所以需要安装java-1.8.0-openjdk
- 修改主机名,设置主机名映射
- 修改配置文件
- 启动服务
- 检查服务
[root@es1 ~]# cat /etc/yum.repos.d/local.repo
[http]		#centos7.5自带的软件包
name=http
baseurl = http://192.168.1.51    #将光盘挂载到/var/www/html
enabled=1
gpgcheck=0

[ftp]   //自定义的软件包
name = ftp
baseurl = ftp://192.168.1.51/ansible  #将自定义yum源拷贝到/var/ftp/
enabled=1
gpgcheck=0


[root@se1 ~]# vim /etc/hosts    //配置主机映射
192.168.1.51 es1
192.168.1.52 es2
192.168.1.53 es3
192.168.1.54 es4
192.168.1.55 es5

[root@es1 ~]#  yum -y install java-1.8.0-openjdk elasticsearch
[root@es1 ~]# vim /etc/elasticsearch/elasticsearch.yml   #修改主配置文件
cluster.name: myelk        将17行配置集群名字
node.name: es1        将23行当前主机名称
network.host: 0.0.0.0   将54行 0.0.0.0(监听所有地址)
discovery.zen.ping.unicast.hosts: ["es1", "es2", "es3"]  68行声明集群里的主机成员有谁,不需要全部写进去
:wq
[root@es1 ~]# systemctl restart elasticsearch.service   #重启服务

[root@es1 ~]# curl http://127.0.0.1:9200   #访问验证
{
  "name" : "es1",   #节点名称
  "cluster_name" : "myelk",  #集群名称
  "version" : {
    "number" : "2.3.4",
    "build_hash" : "e455fd0c13dceca8dbbdbb1665d068ae55dabe3f",
    "build_timestamp" : "2016-06-30T11:24:31Z",
    "build_snapshot" : false,
    "lucene_version" : "5.5.0"
  },
  "tagline" : "You Know, for Search"
}

返回一组json数据表示这台elashticsearch数据库安装成功
部署其他四台:
- 用ansible批量部署(ansible搭建环境及使用方法见上一章博客)
- 修改第一台 es的配置文件将第23 行改为 node.name: {{ ansible_hostname }}
- 编写playbook实现批量部署
- 验证
[root@es1 ~]# vim es.yml
---
- name: 部署ES集群
  hosts: es
  tasks:
   - name: 拷贝主机名映射文件
     copy:
       src: /etc/hosts
       dest: /etc/hosts
       owner: root
       group: root
       mode: 0644

   - name: 拷贝YUM源
     copy:
       src: /etc/yum.repos.d/local.repo
       dest: /etc/yum.repos.d/local.repo
       owner: root
       group: root
       mode: 0644

   - name: 安装elasticsearch软件和java-1.8.0
     yum:
       name: java-1.8.0-openjdk,elasticsearch
       state: installed
       update_cache: yes

   - name: 拷贝集群主配置文件
     template:   #使用remplate模块可以解析配置文件中的变量
       src: /etc/elasticsearch/elasticsearch.yml
       dest: /etc/elasticsearch/elasticsearch.yml
       owner: root
       group: root
       mode: 0644

   - name: 重启elasticsearch服务
     service:
       name: elasticsearch.service
       state: restarted

[root@es1 ~]# ansible-playbook es.yml  #执行palybook
[root@es1 ~]# curl  http://192.168.1.51:9200/_cluster/health?pretty  #查看集群状态
{
  "cluster_name" : "myelk",
  "status" : "green",   			#green表示正常
  "timed_out" : false,
  "number_of_nodes" : 5,   		#机器节点有5台
  "number_of_data_nodes" : 5,
  "active_primary_shards" : 0,
  "active_shards" : 0,
  "relocating_shards" : 0,
  "initializing_shards" : 0,
  "unassigned_shards" : 0,
  "delayed_unassigned_shards" : 0,
  "number_of_pending_tasks" : 0,
  "number_of_in_flight_fetch" : 0,
  "task_max_waiting_in_queue_millis" : 0,
  "active_shards_percent_as_number" : 100.0
}
部署ES插件
- 插件要安装在/usr/share/elasticsearch/bin下
- 在/usr/share/elasticsearch/bin下有个可执行文件plugin
- 在哪台机器上安装的只能在哪台机器上访问(这里安装在es5上)
- 插件的三种使用方法
- ./plugin install 下载插件
- ./plugin remove 移除插件
- ./plugin list 列出插件
[root@es5 ~]# ftp 192.168.1.51
ftp> ls
drwxr-xr-x    3 0        0            4096 Jun 30 03:10 ansible
drwxr-xr-x    2 0        0               6 Jun 23 05:05 centos-1804
drwxr-xr-x    2 0        0             106 Jun 30 03:10 elk
226 Directory send OK.
ftp> cd elk
250 Directory successfully changed.
ftp> ls
227 Entering Passive Mode (192,168,1,51,149,149).
150 Here comes the directory listing.
-rw-r--r--    1 0        0          274341 Jun 29 14:49 bigdesk-master.zip
-rw-r--r--    1 0        0          899857 Jun 29 14:49 elasticsearch-head-master.zip
-rw-r--r--    1 0        0         2228148 Jun 29 14:49 elasticsearch-kopf-master.zip
[root@es5 ~]# cd /usr/share/elasticsearch/bin/   #必须在此目录下载
[root@es5 bin]# ./plugin  install ftp://192.168.1.51/elk/elasticsearch-head-master.zip
[root@es5 bin]# ./plugin  install ftp://192.168.1.51/elk/elasticsearch-kopf-master.zip
[root@es5 bin]#./plugin  install ftp://192.168.1.51/elk/bigdesk-master.zip
[root@es5 bin]# ./plugin list 	#列出插件
Installed plugins in /usr/share/elasticsearch/plugins:
    - head
    - kopf
    - bigdesk
访问插件测试(这里拿head插件举例):
- firefox 192.168.1.55:9200/_plugin/head(也可以直接用真机浏览器访问,前提为真机可以ping通该主机)
- firefox 192.168.1.55:9200/_plugin/bigdesk
- firefox 192.168.1.55:9200/_plugin/kopf

ES数据库的增删改查 - curl 常用参数介绍
- -A 修改请求agent
- -X 设置请求方法
- -I 显示返回头信息
_cat提供一组查询集群的信息
[root@ecs-proxy ~]# curl 192.168.1.51:9200/_cat  #列出API的支持
=^.^=
/_cat/allocation
/_cat/shards
/_cat/shards/{index}
/_cat/master		#集群的主节点是哪个
/_cat/nodes			#集群的节点信息
/_cat/indices
/_cat/indices/{index}
/_cat/segments
/_cat/segments/{index}
/_cat/count
/_cat/count/{index}
/_cat/recovery
/_cat/recovery/{index}
/_cat/health		#集群健康状态
/_cat/pending_tasks
/_cat/aliases
/_cat/aliases/{alias}
/_cat/thread_pool
/_cat/plugins      #集群的插件
/_cat/fielddata
/_cat/fielddata/{fields}
/_cat/nodeattrs
/_cat/repositories
/_cat/snapshots/{repository}

[root@ecs-proxy ~]# curl -XGET 192.168.1.51:9200/_cat/master?v  #查看集群主节点 ?v表示显示详细信息
id                       host         	ip         node
Gn2JfHDUQXywHOsfCjx2YQ 192.168.1.53 192.168.1.53 ecs-0003
[root@ecs-proxy ~]# curl -XGET 192.168.1.51:9200/_cat/nodes?v  #查看集群节点信息
host         ip           heap.percent ram.percent load node.role master name
192.168.1.53 192.168.1.53            3          60 0.00 d         *      ecs-0003
192.168.1.55 192.168.1.55            8          60 0.00 d         m      ecs-0005
192.168.1.54 192.168.1.54            2          60 0.00 d         m      ecs-0004
192.168.1.52 192.168.1.52            2          60 0.00 d         m      ecs-0002
192.168.1.51 192.168.1.51            3          61 0.00 d         m      ecs-0001
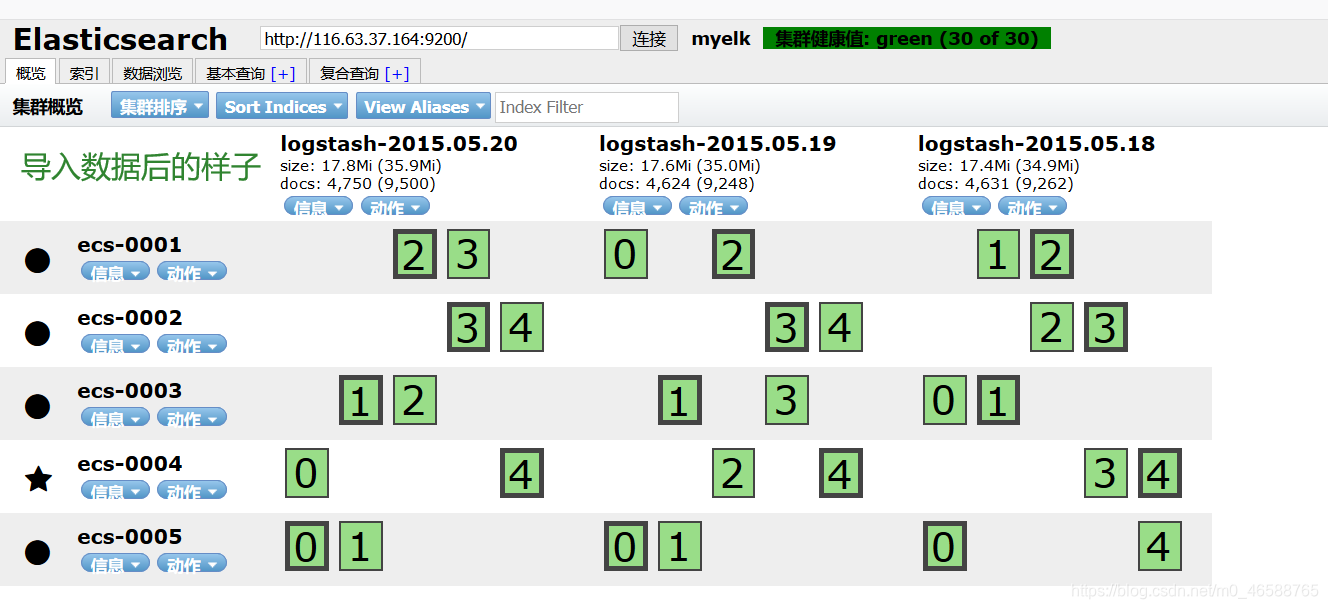
数据导入
- 必须使用POST方式
- 数据格式必须是json
- 编码格式data-binary
- 使用关键字_bulk导入数据
导入提前准备的json格式的日志
[root@ecs-0001 ~]# gzip -d logs.jsonl.gz   #解压缩
[root@ecs-0001 ~]# ls
logs.jsonl
[root@ecs-0001 ~]#curl -XPOST http://192.168.1.52:9200/_bulk --data-binary @logs.jsonl  #在任意节点将数据写入都可以
数据导入后的样子:
二:安装kibana
[root@kibana ~]# yum -y install kibana  #yum源配置文件同上
[root@kibana ~]# vim /etc/hosts     #修改主机名映射文件
192.168.1.51 ecs-0001
192.168.1.52 ecs-0002
192.168.1.53 ecs-0003
192.168.1.54 ecs-0004
192.168.1.55 ecs-0005
192.168.1.56 kibana
[root@kibana ~]#  Vim /opt/kibana/config/kibana.yml	//修改kibana的配置文件
server.port: 5601  //服务监听的端口号
server.host: "0.0.0.0"	//监听的地址
Elasticsearch.url: http://192.168.1.51:9200	//后台集群地址其他去除注释
kibana.index: ".kibana"	//自动在数据库生成.kibana索引来存数据
kibana.defaultAppId: "discover"	//服务的默认首页
elasticsearch.pingTimeout: 1500
elasticsearch.requestTimeout: 30000
elasticsearch.startupTimeout: 5000

[root@kibana ~]#  systemctl start kibana
[root@kibana ~]#  systemctl enable kibana
[root@kibana ~]#  ss -ntulp | grep 5601
访问验证
真机浏览器访问kibana主机ip:5601


匹配数据


修改时间(kibana会根据导入到es数据库的日志进行绘图并呈现出来)

kibana自动绘制出图表

除了柱状图,Kibana还支持很多种展示方式

做一个饼图,选择Pie chart

选择from a new serach

选择Spilt Slices

显示哪个国家访问网站次数最多(前五名)
 绘制二级饼图(在刚才图的基础上)

查看使用的哪种操作系统多
 保存(这里又绘制了一张图表,保存方法都一样)
 一次查看多张表

三. 部署logstash
logstash是什么
- 是一个数据采集,加工处理以及传输的工具
- 所有类型的数据集中处理
- 不同模式和格式数据的正常化
- 自定义日志格式的迅速扩展
- 未自定义数据源轻松添加插件
logstash 里的三个模块
- input模块 :作用是负责日志收集
- filter模块:负责对日志的加工处理将其转为json格式
- output模块: 负责将日志写出到es集群中
修改主机名映射文件告知logstash集群的成员
[root@logstash ~]# vim /etc/hosts
192.168.1.51 ecs1
192.168.1.52 ecs2
192.168.1.53 ecs3
192.168.1.54 ecs4
192.168.1.55 ecs5
192.168.1.56 kibana
192.168.1.57 logstash
安装
[root@logstash ~]#  yum -y install java-1.8.0-openjdk
[root@logstash ~]# yum -y install logstash
修改配置文件测试运行
[root@ecs-logstash ~]# cd /etc/logstash/
[root@ecs-logstash logstash]# touch logstash.cnf   #创建logstash配置文件
[root@ecs-logstash logstash]# vim logstash.cnf
input {
  stdin {}  #标准输入
} #定义区域


filter {}

output{
  stdout {} #标准输出
}

[root@ecs-logstash bin]# /opt/logstash/bin/logstash -f /etc/logstash/logstash.cnf  #-f 表示加载配置文件
Settings: Default pipeline workers: 2
Pipeline main started  #出现这个表示运行成功,并等待用户输入
test logstash is health  # 用户输入的字符串
2020-07-04T07:03:48.463Z ecs-logstash test logstash is health  #logstash输出的
logstash插件的使用:
[root@ecs-logstash bin]# /opt/logstash/bin/logstash-plugin  list #列出logstash的插件
[root@ecs-logstash bin]# vim /etc/logstash/logstash.cnf
input {
  stdin  { codec => "json"}  // codec定义将输入的格式为"json"
}


filter {}

output{
  stdout { codec => "rubydebug"}  // codec定义将输出的格式为rubydebug(易读)
}

[root@ecs-logstash bin]# ./logstash -f /etc/logstash /logstash.cnf
Settings: Default pipeline workers: 2
Pipeline main started
{"aa":1,"bb":2,"cc":3}  //输入一组json格式的数据
{
            "aa" => 1,
            "bb" => 2,
            "cc" => 3,
      "@version" => "1",
    "@timestamp" => "2020-07-04T07:29:08.391Z",
          "host" => "ecs-logstash"
}
官方文档(查看各区域中插件的使用):
https://www.elastic.co/guide/en/logstash/current/index.html
input区域的使用:
- input区域的作用是读取日志文件(收集素材)
[root@ecs-logstash ~]# vim /etc/logstash/logstash.cnf
input {
  stdin  { codec => "json"}  # codec表示输入的格式为"json"
  file {
   path => [ "/tmp/apache.log", "/tmp/db.log" ]
 }
}


filter {}

output{
  stdout { codec => "rubydebug"}  #codec表示将输出的格式定义为rubydebug模式(易读)
}
[root@ecs-logstash tmp]# /opt/logstash/bin/logstash -f /etc/logstash/logstash.cnf  #运行加载logstash文件
Settings: Default pipeline workers: 2
Pipeline main started

另外开一个终端连接到logstash主机上
[root@ecs-logstash ~]# cd /tmp
[root@ecs-logstash tmp]# touch apache.log db.log
[root@ecs-logstash tmp]# echo A_${RANDOM} > apache.log
[root@ecs-logstash tmp]# echo B_${RANDOM} > db.log  #随机往日志里写东西

此时查看第一个终端
{
       "message" => "A_31017",
      "@version" => "1",
    "@timestamp" => "2020-07-04T08:28:42.986Z",
          "path" => "/tmp/apache.log",
          "host" => "ecs-logstash"
}
{
       "message" => "B_11512",
      "@version" => "1",
    "@timestamp" => "2020-07-04T08:30:19.040Z",
          "path" => "/tmp/db.log",
          "host" => "ecs-logstash"
}
就会发现logstash将日志的内容给显示出在屏幕上了
那当日志文件里已经有日志记录了该怎么办呢?
使用file插件里的sincedb_path 和 start_position 参数
[root@ecs-logstash ~]# vim /etc/logstash/logstash.cnf
input {
  stdin  { codec => "json"}  # codec表示输入的格式为"json"
  file {
    path => [ "/tmp/apache.log" ]
    sincedb_path => "/root/.sincedb" #指定指针记录文件的存放路径,不指定是默认存放在当前用户的家目录下的(隐藏文件)
    start_position => "beginning" #当没有指针记录文件时从第一条日志开始读取
    type => "httplog"  #打个标签方便标识
 }
  file {
    path => [ "/tmp/db.log" ,"xx.log"]
    sincedb_path => "/root/.sincedb"
    start_position => "beginning"
    type => "mysqllog"
 }
}


filter {
}

output{
  stdout { codec => "rubydebug"}  #codec表示将输出的格式定义为rubydebug模式(易读)
}

打开第二个终端将写两条日志测试
[root@ecs-logstash tmp]# echo X_${RANDOM} >> xx.log
[root@ecs-logstash tmp]# echo X_${RANDOM} >> xx.log

返回第一个终端运行加载配置文件
[root@ecs-logstash ~]# /opt/logstash/bin/logstash -f /etc/logstash/logstash.cnf
Settings: Default pipeline workers: 2
Pipeline main started
{
       "message" => "X_28128",
      "@version" => "1",
    "@timestamp" => "2020-07-04T09:03:31.028Z",
          "path" => "/tmp/xx.log",
          "host" => "ecs-logstash",
          "type" => "mysqllog"
}
{
       "message" => "X_6186",
      "@version" => "1",
    "@timestamp" => "2020-07-04T09:03:31.029Z",
          "path" => "/tmp/xx.log",
          "host" => "ecs-logstash",
          "type" => "mysqllog"
}
从这里就能看出可以将新的日志文件从头读取

当logstash服务停止的时候,因为有指针记录文件所以也是可以从断点继续读取日志文件
先将服务停止,向/tmp/xx.log写入日志记录
[root@ecs-logstash tmp]# echo "停止服务再写日志也是可以读出来的 "  >> xx.log
再次启动服务加载配置文件
[root@ecs-logstash ~]# /opt/logstash/bin/logstash -f /etc/logstash/logstash.cnf
Settings: Default pipeline workers: 2
Pipeline main started
{
       "message" => "停止服务再写日志也是可以读出来的 ",
      "@version" => "1",
    "@timestamp" => "2020-07-04T09:08:27.291Z",
          "path" => "/tmp/xx.log",
          "host" => "ecs-logstash",
          "type" => "mysqllog"
}
filter区域的使用:
- filter的作用是将日志记录转化为json格式
- 这里使用 grok 模块
首先搭建web服务器,并真机访问测试
[root@ecs-web ~]# yum -y install httpd
[root@ecs-web ~]# systemctl start httpd
[root@ecs-web ~]# cat /var/log/httpd/access_log
100.125.27.29 - - [04/Jul/2020:17:23:13 +0800] "GET / HTTP/1.1" 200 12 "-" "Mozilla/5.0 (Windows NT 10.0; Win64; x64; rv:78.0) Gecko/20100101 Firefox/78.0"

httpd日志格式解析:
100.125.27.29  :表示来访者IP地址
"- -" :表示远程日志和远程用户(开启认证的web网站才有参数) 这里为空
[04/Jul/2020:17:23:13 +0800] :表示时间戳
GET  :表示请求方法
/  : 表示访问地址的URL
/ HTTP/1.1 :表示请求的协议和版本
200  :表示返回值
12  :表示页面的大小

将web主机上的访问日志拷贝到logstash主机上测试filter模块的使用
[root@ecs-logstash ]# vim /tmp/apache.log
100.125.27.29 - - [04/Jul/2020:17:23:13 +0800] "GET / HTTP/1.1" 200 12 "-" "Mozilla/5.0 (Windows NT 10.0; Win64; x64; rv:78.0) Gecko/20100101 Firefox/78.0"
将真实的日志记录写进去

修改配置文件
[root@ecs-logstash ]# vim /etc/logstash/logstash.cnf
input {
  stdin  { codec => "json"}
  file {
   path => [ "/tmp/apache.log" ]
   sincedb_path => "/dev/null"  #多次测试可以将指针记录文件修改为dev/null里
   start_position => "beginning"
   type => "httplog"
 }
}


filter {
  grok {
    match => { "message" => "%{COMBINEDAPACHELOG}" } #利用grok模块匹配日志文件的各项含义
	#调用logstash作者已经写好的正则表达式,在这里称作为宏COMBINEDAPACHELOG
}
}

output{
  stdout { codec => "rubydebug"}
}

[root@ecs-logstash ~]# cd /opt/logstash/vendor/bundle/jruby/1.9/gems/logstash-p
#作者写的宏的存放路径
[root@ecs-logstash patterns]# cat grok-patterns

测试运行
[root@ecs-logstash bin]# ./logstash -f /etc/logstash/logstash.cnf
Settings: Default pipeline workers: 2
Pipeline main started
{
        "message" => "100.125.27.29 - - [04/Jul/2020:17:23:13 +0800] \"GET / HTTP/1.1\" 200 12 \"-\" \"Mozilla/5.0 (Windows NT 10.0; Win64; x64; rv:78.0) Gecko/20100101 Firefox/78.0\"",
       "@version" => "1",
     "@timestamp" => "2020-07-04T10:36:14.970Z",
           "path" => "/tmp/apache.log",
           "host" => "ecs-logstash",
           "type" => "httplog",
       "clientip" => "100.125.27.29",
          "ident" => "-",
           "auth" => "-",
      "timestamp" => "04/Jul/2020:17:23:13 +0800",
           "verb" => "GET",
        "request" => "/",
    "httpversion" => "1.1",
       "response" => "200",
          "bytes" => "12",
       "referrer" => "\"-\"",
          "agent" => "\"Mozilla/5.0 (Windows NT 10.0; Win64; x64; rv:78.0) Gecko/20100101 Firefox/78.0\""
}
output区域的使用:
- output的作用时将json格式的日志写到ES分布式集群中
- 这里使用 elasticsearch 模块
[root@ecs-logstash bin]# vim /etc/logstash/logstash.cnf
input {
  stdin  { codec => "json"}
  file {
   path => [ "/tmp/apache.log" ]
   sincedb_path => "/dev/null"
   start_position => "beginning"
   type => "httplog"
 }
}


filter {
  grok {
    match => { "message" => "%{COMBINEDAPACHELOG}" }
}
}

output{
  stdout { codec => "rubydebug"}
  elasticsearch {
    hosts => ["ecs-0001:9200","ecs-0002:9200","ecs-0003:9200"] #告知logstash,ES集群的名字,
    #ecs-0001/2/3必须可以ping通
    index => "web-%{+YYYY.MM.dd}"  #在es集群中创建索引(库名)的名称
    flush_size => 2000  #先将数据缓存到本地当达到2000字节时写到ES数据库中
    idle_flush_time => 10  #当10秒没有数据写进来时,将本地数据写入ES分布式集群中
}
}

测试运行
[root@ecs-logstash bin]# /opt/logstash/bin/logstash -f /etc/logstash/logstash.cnf
Settings: Default pipeline workers: 2
Pipeline main started
{
        "message" => "100.125.27.29 - - [04/Jul/2020:17:23:13 +0800] \"GET / HTTP/1.1\" 200 12 \"-\" \"Mozilla/5.0 (Windows NT 10.0; Win64; x64; rv:78.0) Gecko/20100101 Firefox/78.0\"",
       "@version" => "1",
     "@timestamp" => "2020-07-04T10:58:51.005Z",
           "path" => "/tmp/apache.log",
           "host" => "ecs-logstash",
           "type" => "httplog",
       "clientip" => "100.125.27.29",
          "ident" => "-",
           "auth" => "-",
      "timestamp" => "04/Jul/2020:17:23:13 +0800",
           "verb" => "GET",
        "request" => "/",
    "httpversion" => "1.1",
       "response" => "200",
          "bytes" => "12",
       "referrer" => "\"-\"",
          "agent" => "\"Mozilla/5.0 (Windows NT 10.0; Win64; x64; rv:78.0) Gecko/20100101 Firefox/78.0\""
}
用浏览器访问head插件(我把head插件安装在了192.168.1.55上)
http://192.168.1.55/_plugin/head/
 此时我们发现在head插件上有个名为web的索引说明数据已经成功写入ES分布式集群中
filebeats
首先要在web主机上安装filebeats
- 作用是在本地读取web日志,通过本地网络最终将日志发送给logstash
修改logstash配置文件添加beats模块
[root@ecs-logstash bin]# vim /etc/logstash/logstash.cnf
input {
  stdin  { codec => "json"}
  file {
   path => [ "/tmp/apache.log" ]
   sincedb_path => "/root/.sincedb"
   start_position => "beginning"
   type => "httplog"
 }
  beats {
    port => 5044  #logstash将监听5044这个端口,等待web主机发送web日志
 }
}
.....

运行logstash
[root@ecs-logstash ~]# /opt/logstash/bin/logstash -f /etc/logstash/logstash.cnf
Settings: Default pipeline workers: 2
Pipeline main started

另开终端查看是否监听5044端口
[root@ecs-logstash ~]# ss -ntulp | grep 5044
tcp    LISTEN     0      50     [::]:5044               [::]:*                   users:(("java",pid=14514,fd=14))


登录web主机安装filebeat
[root@ecs-web ~]# yum -y install filebeat
[root@ecs-web ~]# systemctl start filebeat
[root@ecs-web ~]# systemctl enable filebeat
[root@ecs-web ~]# vim /etc/filebeat/filebeat.yml
修改15行    - /var/log/httpd/access_log  #定义传输日志文件的路径
修改72行     document_type: apache.log  #打标签定义是什么日志
修改183行添加注释  #elasticsearch:  #默认web主机是将日志输出给es集群
修改278行去除注释  logstash: #定义web主机将日志输出给logsstash
修改280行  hosts: ["192.168.1.57:5044"] #告知web机器logstash地址

[root@ecs-web ~]# grep -Pv "^\s*(#|$)" /etc/filebeat  /filebeat.yml  #查看有效配置
filebeat:
  prospectors:
    -
      paths:
        - /var/log/httpd/access_log
      input_type: log
      document_type: apache.log
  registry_file: /var/lib/filebeat/registry
output:
  logstash:
    hosts: ["192.168.1.57:5044"]
shipper:
logging:
  files:
    rotateeverybytes: 10485760 # = 10MB


修改logstash配置文件匹配相应标签的日志
[root@ecs-logstash ~]# vim /etc/logstash/logstash.cnf
input {
  stdin  { codec => "json"}
  file {
   path => [ "/tmp/apache.log" ]
   sincedb_path => "/root/.sincedb"
   start_position => "beginning"
   type => "httplog"
 }
  beats {
    port => 5044
 }
}


filter {
  if [type] == "apache.log" {  #匹配日志标签是apache.log的,才加载grok模块
  grok {
    match => { "message" => "%{COMBINEDAPACHELOG}" }
  #if [type] == "nginx.log" { #可以匹配多个标签
  ....
}}
}

output{
  stdout { codec => "rubydebug"}
  if [type] == "apache.log" {   #匹配日志标签是apache.log的
  elasticsearch {
    hosts => ["ecs-0001:9200","ecs-0002:9200","ecs-0003:9200"]
    index => "web-%{+YYYY.MM.dd}"
    flush_size => 2000
    idle_flush_time => 10
}}
}

运行logstash
[root@ecs-logstash ~]# /opt/logstash/bin/logstash -f /etc/logstash/logstash.cnf

真机访问web网站
[root@ecs-web ~]#http://192.168.1.58:80

再次查看logstash主机的显示(等待十几秒)
"message" => "100.125.27.13 - - [04/Jul/2020:20:12:10 +0800] \"GET / HTTP/1.1\" 304 - \"-\" \"Mozilla/5.0 (Windows NT 10.0; Win64; x64; rv:78.0) Gecko/20100101 Firefox/78.0\"",
       "@version" => "1",
     "@timestamp" => "2020-07-04T12:12:16.770Z",
         "offset" => 6200,
     "input_type" => "log",
           "beat" => {
        "hostname" => "ecs-web",
            "name" => "ecs-web"
    },
         "source" => "/var/log/httpd/access_log",
           "type" => "apache.log",
          "count" => 1,
         "fields" => nil,
           "host" => "ecs-web",
           "tags" => [
        [0] "beats_input_codec_plain_applied"
    ],
       "clientip" => "100.125.27.13",
          "ident" => "-",
           "auth" => "-",
      "timestamp" => "04/Jul/2020:20:12:10 +0800",
           "verb" => "GET",
        "request" => "/",
    "httpversion" => "1.1",
       "response" => "304",
       "referrer" => "\"-\"",
          "agent" => "\"Mozilla/5.0 (Windows NT 10.0; Win64; x64; rv:78.0) Gecko/20100101 Firefox/78.0\""
}
此时说明web主机成功将本地的http日志文件通过网络传送给logstash主机了
将所有组件串联
[root@kibana ~]# systemctl stop kibana
[root@kibana ~]# curl -XDELETE http://ecs-0002:9200/*  删除所有测试索引
[root@kibana ~]# systemctl start kibana

运行logstash
[root@ecs-logstash ~]# /opt/logstash/bin/logstash -f /etc/logstash/logstash.cnf

真机访问web网站
[root@ecs-web ~]#http://192.168.1.58:80

真机查看56主机上的head插件,查看是否有web开头的索引
[root@ecs-0005 ~]#http://192.168.1.56:9200/_plugin/head

使用kibana绘制图表


再次访问web网站的页面
通过logstash查看测试访问的时间

最后观察kibana(如果访问多我们还可以绘制饼图)
绘制饼图方法见上方kibana介绍


 2390
2390

 被折叠的 条评论
为什么被折叠?
被折叠的 条评论
为什么被折叠?
 到【灌水乐园】发言


