


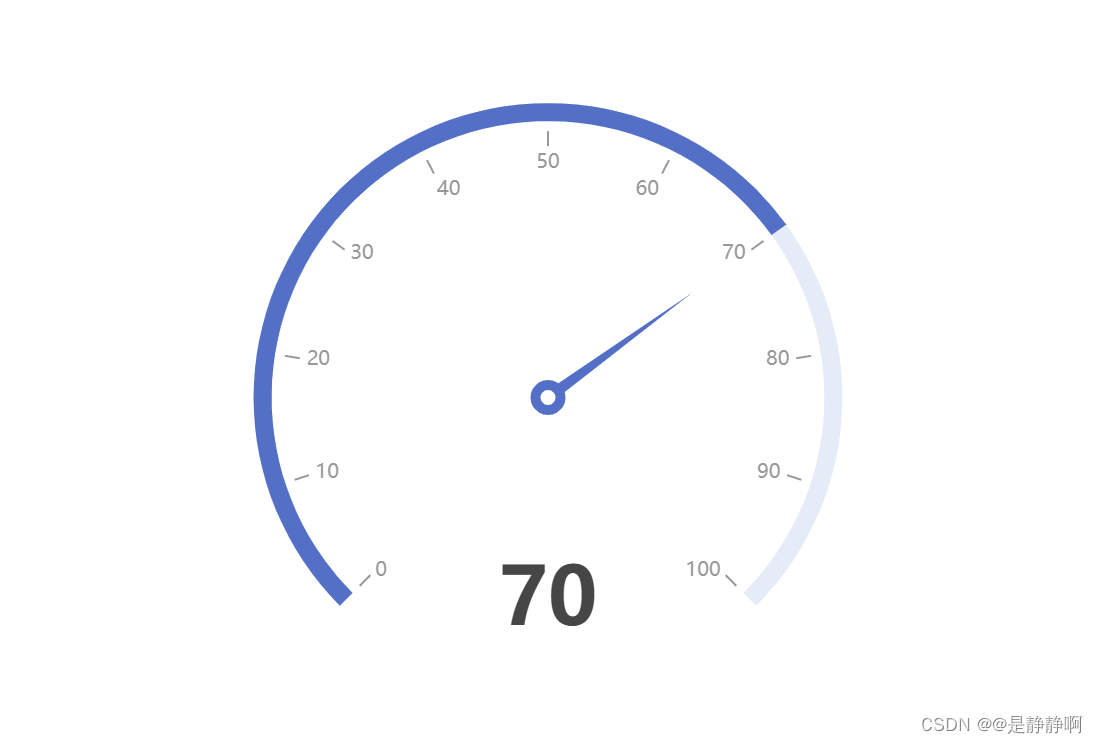
得分图表
main.js文件
// 引入echarts-5.0
import * as echarts from 'echarts'
Vue.prototype.$echarts = echarts
Test.vue文件
// 重点
// 1.div设置id/class/ref;设置画布width,height(css样式)
// 2.let chartDom = document.getElementById('lineDemo') 获取dom节点
// 2.let myChart =this.$echarts.init(chartDom) 初始化echarts实例
//3.myChart.setOption(this.option) 写入echarts配置项 详情见官网配置文档

<template>
  <div class="container">
    <h1>{{ title }}</h1>
    <div class="echart" id="lineDemo1" ref="chart"></div>
    <div class="echart" id="lineDemo2" ref="chart"></div>
  </div>
</template>

<script>
export default {
  name: 'index',
  data () {
    return {
      title: 'echarts-demo',
      option1 : {
  series: [
    {
      type: 'gauge',
      progress: {
        show: true,
        width: 18
      },
      axisLine: {
        lineStyle: {
          width: 18
        }
      },
      axisTick: {
        show: false,
        splitNumber: 100
      },
      splitLine: {
        length: 15,
        lineStyle: {
          width: 2,
          color: '#999'
        }
      },
      axisLabel: {
        distance: 20,
        color: '#999',
        fontSize: 20
      },
      anchor: {
        show: true,
        showAbove: true,
        size: 20,
        itemStyle: {
          borderWidth: 10
        }
      },
      title: {
        show: false
      },
      detail: {
        valueAnimation: true,
        fontSize: 80,
        show: false,
        offsetCenter: [0, '70%']
      },
      title: {
        show: true,
        fontSize: 40,
        offsetCenter: [0, '70%']
      },
      data: [
        {
          value: '80',
          name: '得分'
        }
      ],
      max: 120,
      splitNumber: 6,
      radius: '100%'
    }
  ]
},
option2 : {
  series: [
    {
      type: 'gauge',
      progress: {
        show: true,
        width: 18
      },
      axisLine: {
        lineStyle: {
          width: 18
        }
      },
      axisTick: {
        show: false,
        splitNumber: 100
      },
      splitLine: {
        length: 15,
        lineStyle: {
          width: 2,
          color: '#999'
        }
      },
      axisLabel: {
        distance: 20,
        color: '#999',
        fontSize: 20
      },
      anchor: {
        show: true,
        showAbove: true,
        size: 20,
        itemStyle: {
          borderWidth: 10
        }
      },
      title: {
        show: false
      },
      detail: {
        valueAnimation: true,
        fontSize: 40,
        show: false,
        offsetCenter: [0, '70%']
      },
      title: {
        show: true,
        fontSize: 40,
        offsetCenter: [0, '70%']
      },
      data: [
        {
          value: '60',
          name: '得分'
        }
      ],
      max: 100,
      splitNumber: 5,
      radius: '100%'
    }
  ]
}
    }
  },
  mounted () {
    let chartDom1 = document.getElementById('lineDemo1')
    let myChart1 = this.$echarts.init(chartDom1)
    myChart1.clear()
    myChart1.setOption(this.option1)
    let chartDom2 = document.getElementById('lineDemo2')
    let myChart2 = this.$echarts.init(chartDom2)
    myChart2.clear()
    myChart2.setOption(this.option2)
  },
  methods: {},
  watch: {},
  created () {
  }
}
</script>

<style scoped>
.echart {
  width: 360px;
  height: 360px;
}
</style>
图:


 被折叠的 条评论
为什么被折叠?
被折叠的 条评论
为什么被折叠?
 到【灌水乐园】发言


