使用echarts实现折线图的拖拽
<!DOCTYPE html>
<html>
<head>
<meta charset="utf-8">
<script src="./echarts.js"></script>
</head>
<body>
<div id="main" style="width: 600px;height:400px;"></div>
<script type="text/javascript">
var symbolSize = 20;
var data = [[15, 0], [-50, 10], [-56.5, 20], [-46.5, 30], [-22.1, 40]];
var myChart = echarts.init(document.getElementById('main'));
myChart.setOption({
tooltip: {
triggerOn: 'none',
formatter: function (params) {
return 'X: ' + params.data[0].toFixed(2) + '<br>Y: ' + params.data[1].toFixed(2);
}
},
xAxis: {
min: -100,
max: 80,
type: 'value',
axisLine: {onZero: false}
},
yAxis: {
min: -30,
max: 60,
type: 'value',
axisLine: {onZero: false}
},
series: [
{
id: 'a',
type: 'line',
smooth: true,
symbolSize: symbolSize,
data: data
}
],
});
myChart.setOption({
graphic: echarts.util.map(data, function (item, dataIndex) {
return {
type: 'circle',
position: myChart.convertToPixel('grid', item),
shape: {
r: symbolSize / 2
},
invisible: true,
draggable: true,
ondrag: echarts.util.curry(onPointDragging, dataIndex),
onmousemove: echarts.util.curry(showTooltip, dataIndex),
onmouseout: echarts.util.curry(hideTooltip, dataIndex),
z: 100
};
})
});
window.addEventListener('resize', function () {
myChart.setOption({
graphic: echarts.util.map(data, function (item, dataIndex) {
return {
position: myChart.convertToPixel('grid', item)
};
})
});
});
function showTooltip(dataIndex) {
myChart.dispatchAction({
type: 'showTip',
seriesIndex: 0,
dataIndex: dataIndex
});
}
function hideTooltip(dataIndex) {
myChart.dispatchAction({
type: 'hideTip'
});
}
function onPointDragging(dataIndex, dx, dy) {
data[dataIndex] = myChart.convertFromPixel('grid', this.position);
myChart.setOption({
series: [{
id: 'a',
data: data
}]
});
}
</script>
</body>
</html>
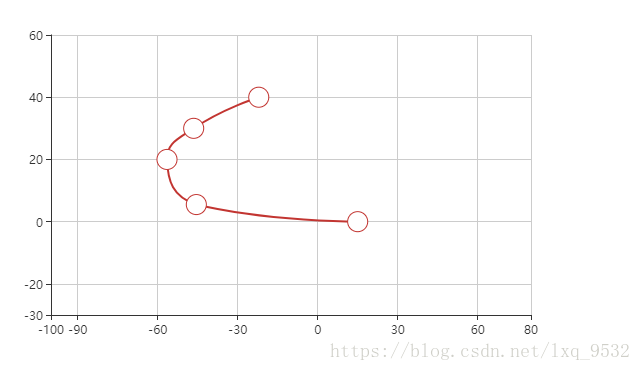
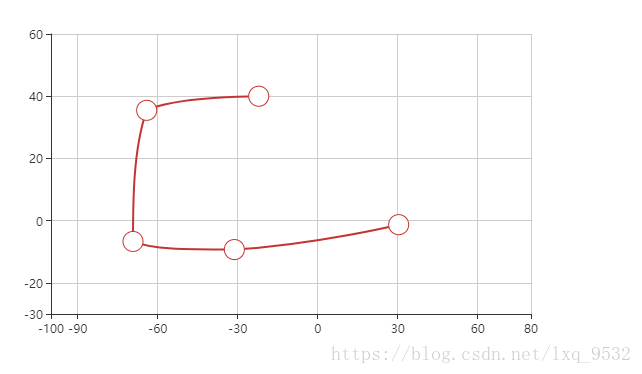


 本文介绍如何利用Echarts库为折线图添加拖拽功能,允许用户交互式地改变数据点的位置,增强数据可视化的交互体验。


 273
273

 被折叠的 条评论
为什么被折叠?
被折叠的 条评论
为什么被折叠?
 到【灌水乐园】发言


