


最近公司在香港有新项目,于是便要求大屏上显示香港地图;
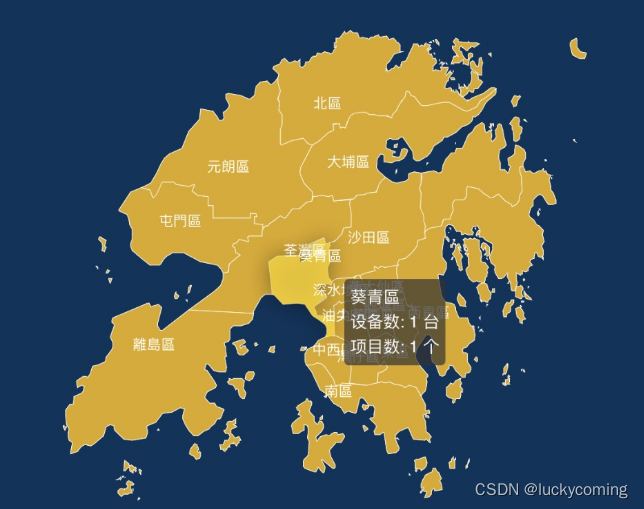
最终实现如图:
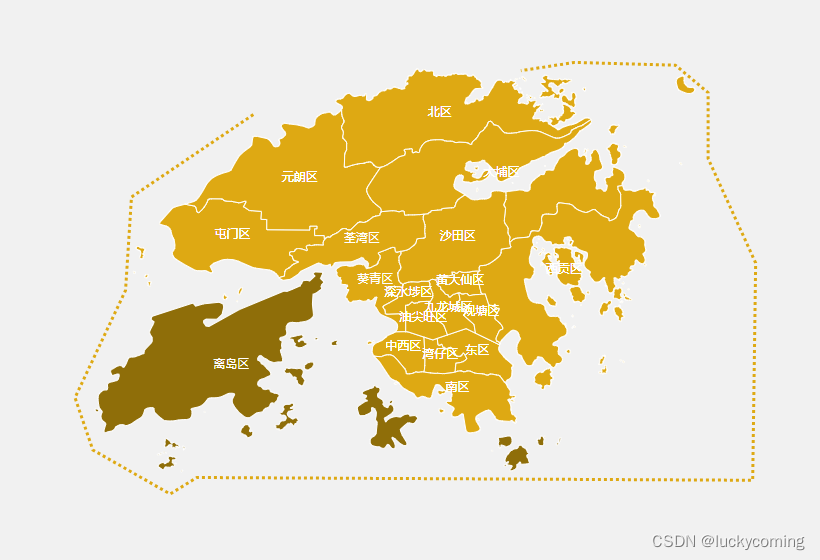
一开始使用的echarts来渲染香港地图,效果如下:
但是这份JSON数据实现的香港地图和实际地图有出入,且使用echarts实现地图宽度会被压缩,所以经理就在群里说了这个问题,要求换一个更详细的地图;于是我找了百度了很久,最终使用D3.js来绘制该香港地图;代码如下:
<template>
  <div id="chart-container_hk">
    <svg id="chart_hkhk"></svg>
  </div>
</template>

<script>
import * as d3 from "d3";
import hongKongData from "../config/hongKong.json";
import coastlineData from "../config/coastlineData.json";
import api from "../api/fast/index";

export default {
  data() {
    return {
      params: {
        areaCode: "810000",
        areaLevel: "province",
        areaName: "香港",
        name: "香港",
      },
      list: [],
    };
  },
  async mounted() {
    const aid = sessionStorage.getItem("aid");
    api
      .getProjectAndDeviceNumByCity({
        agentId: aid,
        province: this.params.name,
      })
      .then(({ result: res }) => {
        this.list = res;
        console.log(34, this.list);
        this.$nextTick(() => {
 最低0.47元/天 解锁文章


 6726
6726

 被折叠的 条评论
为什么被折叠?
被折叠的 条评论
为什么被折叠?
 到【灌水乐园】发言


