


样式一(echarts)
<template>
	<div class="barContent">
		<div :id="props.chartclass" :style="{ width: '100%', height: '100%' }"></div>
	</div>
</template>
<script setup>
import {
markRaw,
onMounted,
ref,
watch,
onBeforeUnmount
} from "vue";
import * as echarts from "echarts";
const props = defineProps(["chartclass", "chartData"]);
// 初始化chart
let myChart = ref(null);
const resizeHandler = () => {
myChart.value.resize();
};
onMounted(() => {
let chartElement = document.getElementById(props.chartclass);
myChart.value = markRaw(echarts.init(chartElement));
initChart();
window.addEventListener("resize", resizeHandler);
});
onBeforeUnmount(() => {
window.removeEventListener("resize", resizeHandler);
myChart.value.dispose();
});
const initChart = () => {
switch (props.chartclass) {
case "wxfw": //首页-危险废物
initWxfw();
break;
}
};
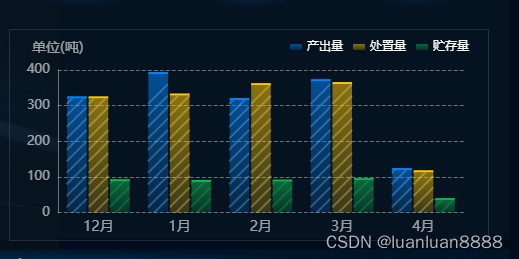
const initWxfw = () => {
var data = {
myDate: ['12月', '1月', '2月', '3月', '4月'],
numA: [320, 388, 315, 368, 119],
numB: [320, 328, 357, 360, 113],
numC: [88, 86, 87, 91, 35],
};
var numD = [6, 6, 6, 6, 6];
var option = {
tooltip: {
trigger: 'axis',
backgroundColor: 'rgba(17,95,182,0.5)',
formatter(param) { // 鼠标滑动到柱子时显示的内容
let html = ''
return html
},
textStyle: {
color: '#fff'
},
axisPointer: {
type: 'shadow',
textStyle: {
color: '#fff'
}
}
},
grid: {
borderWidth: 0,
top: '19%',
right: '5%',
bottom: '13%',
left: '10%',
textStyle: {
color: '#fff'
}
},
calculable: true,
legend: {
itemHeight: 6,
itemWidth: 12,
right: 14,
top: 6,
textStyle: {
color: '#fff'
}
},
xAxis: [{
type: 'category',
splitLine: {
show: false
},
axisTick: {
show: false
},
splitArea: {
show: false
},
axisLabel: {
interval: 0,
// rotate: 50,
textStyle: {
color: 'rgba(255, 255, 255, 0.6)',
fontSize: '14px'
}
},
axisLine: {
show: false,
lineStyle: {
color: '#ffffff'
}
},
data: data.myDate
}],
yAxis: {
type: 'value',
name: '单位(吨)',
nameTextStyle: {
color: 'rgba(255, 255, 255, 0.6)',
fontSize: 14
},
axisLine: {
lineStyle: {
color: 'rgba(255, 255, 255, 0.4)',
width: 1,
type: 'solid'
},
show: true
},
splitLine: {
show: true,
lineStyle: {
color: 'rgba(255, 255, 255, 0.4)',
type: 'dashed'
}
},
axisLabel: {
textStyle: {
color: 'rgba(255, 255, 255, 0.6)',
fontSize: '13px'
}
},
axisTick: {
show: false
}
},
series: [{
name: '产出量',
type: 'bar',
stack: '1',
barMaxWidth: 24,
barGap: '10%',
itemStyle: {
normal: {
show: true,
color: new echarts.graphic.LinearGradient(
0,
0,
0,
1,
[{
offset: 0,
color: 'rgba(0, 133, 255, 0.53)'
},
{
offset: 1,
color: 'rgba(6, 124, 226, 0.21)'
}
],
false
),
barBorderRadius: 0
// label: {
// show: false,
// position: "top",
// color: 'rgba(39, 252, 254, 1)',
// formatter: function (p) {
// return p.value > 0 ? (p.value) : '';
// }
// }
}
},
data: data.numA
},
{
name: '处置量',
type: 'bar',
stack: '2',
barMaxWidth: 24,
barGap: '10%',
itemStyle: {
normal: {
show: true,
color: new echarts.graphic.LinearGradient(
0,
0,
0,
1,
[{
offset: 0,
color: 'rgba(255, 199, 0, 0.53)'
},
{
offset: 1,
color: 'rgba(255, 199, 0, 0.21)'
}
],
false
),
barBorderRadius: 0
/*label: {
show: true,
position: "top",
color: 'rgba(39, 252, 254, 1)',
formatter: function (p) {
return p.value > 0 ? (p.value) : '';
}
}*/
}
},
data: data.numB
},
{
name: '贮存量',
type: 'bar',
stack: '3',
barMaxWidth: 24,
barGap: '10%',
itemStyle: {
normal: {
show: true,
color: new echarts.graphic.LinearGradient(
0,
0,
0,
1,
[{
offset: 0,
color: 'rgba(18, 178, 82, 0.53)'
},
{
offset: 1,
color: 'rgba(18, 178, 82, 0.21)'
}
],
false
),
barBorderRadius: 0
/*label: {
show: true,
position: "top",
color: 'rgba(39, 252, 254, 1)',
formatter: function (p) {
return p.value > 0 ? (p.value) : '';
}
}*/
}
},
data: data.numC
},
{
// 柱状图顶部横线
name: '',
type: 'bar',
stack: '1',
barMaxWidth: 24,
barGap: '10%',
itemStyle: {
normal: {
show: true,
color: new echarts.graphic.LinearGradient(
0,
0,
0,
1,
[{
offset: 0,
color: 'rgba(0, 133, 255, 1)'
},
{
offset: 1,
color: 'rgba(0, 133, 255, 1)'
}
],
false
),
barBorderRadius: 0
}
},
data: numD
},
{
// 柱状图顶部横线
name: '',
tooltip: {
show: false
},
// type: 'pictorialBar',
type: 'bar',
stack: '2',
barMaxWidth: 24,
barGap: '10%',
symbolSize: ['20', '10'],
itemStyle: {
normal: {
show: true,
color: new echarts.graphic.LinearGradient(
0,
0,
0,
1,
[{
offset: 0,
color: 'rgba(255, 199, 0, 1)'
},
{
offset: 1,
color: 'rgba(255, 199, 0, 1)'
}
],
false
),
barBorderRadius: 0
}
},
data: numD
},
{
// 柱状图顶部横线
name: '',
type: 'bar',
stack: '3',
barMaxWidth: 24,
barGap: '10%',
itemStyle: {
normal: {
show: true,
color: new echarts.graphic.LinearGradient(
0,
0,
0,
1,
[{
offset: 0,
color: 'rgba(18, 178, 82, 1)'
},
{
offset: 1,
color: 'rgba(18, 178, 82, 1)'
}
],
false
),
barBorderRadius: 0
}
},
data: numD
},
{
// 斜线分隔-1
type: 'pictorialBar',
tooltip: {
show: false
},
symbolRotate: '-45',
itemStyle: {
normal: {
color: new echarts.graphic.LinearGradient(0, 0, 1, 0, [{
offset: 0,
color: 'rgba(0, 133, 255, 0.31)'
},
{
offset: 1,
color: 'rgba(255, 255, 255, 0.31)'
}
])
}
},
symbolRepeat: 'fixed',
symbolMargin: -8,
symbol: 'rect',
symbolClip: true,
symbolSize: [2, 28],
symbolPosition: 'start',
symbolOffset: [-22, 10],
data: data.numA,
z: 66,
animationEasing: 'elasticOut'
},
{
// 斜线分隔-2
type: 'pictorialBar',
tooltip: {
show: false
},
symbolRotate: '-45',
itemStyle: {
normal: {
color: new echarts.graphic.LinearGradient(0, 0, 1, 0, [{
offset: 0,
color: 'rgba(255, 199, 0, 0.31)'
},
{
offset: 1,
color: 'rgba(255, 255, 255, 0.31)'
}
])
}
},
symbolRepeat: 'fixed',
symbolMargin: -8,
symbol: 'rect',
symbolClip: true,
symbolSize: [2, 28],
symbolPosition: 'start',
symbolOffset: [0, 10],
data: data.numB,
z: 66,
animationEasing: 'elasticOut'
},
{
// 斜线分隔-3
type: 'pictorialBar',
tooltip: {
show: false
},
symbolRotate: '-45',
itemStyle: {
normal: {
color: new echarts.graphic.LinearGradient(0, 0, 1, 0, [{
offset: 0,
color: 'rgba(18, 178, 82, 0.31)'
},
{
offset: 1,
color: 'rgba(18, 178, 82, 0.31)'
}
])
}
},
symbolRepeat: 'fixed',
symbolMargin: -8,
symbol: 'rect',
symbolClip: true,
symbolSize: [2, 28],
symbolPosition: 'start',
symbolOffset: [21, 10],
data: data.numC,
z: 66,
animationEasing: 'elasticOut'
}
]
}
myChart.value.setOption(option);
};
</script>
样式二(echarts)
<template>
	<div class="barContent">
		<div :id="props.chartclass" :style="{ width: '100%', height: '100%' }"></div>
	</div>
</template>
<script>
import * as echarts from "echarts";
import "echarts-gl";
// import 'echarts-gl'
export default {
name: "MyBarChart",
components: {},
props: ["chartclass", "chartData"],
data() {
return {
myChart: null
};
},
created() {
},
beforeCreate() {},
mounted() {
let _this = this;
let dom = _this.$refs.myChart;
_this.myChart = echarts.init(dom);
_this.$nextTick(() => {
_this.initChart();
setTimeout(() => {
// _this.myChart.resize();
}, 100);
});
// window.addEventListener("resize", function() {
// setTimeout(() => {
// // _this.myChart.resize();
// }, 100);
// });
},
methods: {
initChart() {
switch (this.chartclass) {
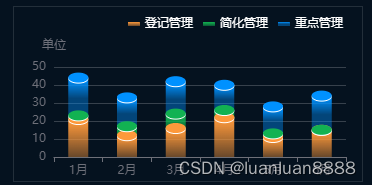
case "wryjg": //首页-污染源监管
this.initWryjG();
break;
}
},
//首页-空气质量-3d柱状图
initWryjG() {
var colorList = ['#FE993B', '#12B252', '#0091FF'];
var colorList1 = [new echarts.graphic.LinearGradient(0, 0, 0, 1, [{
offset: 0,
color: '#FE993B'
},
{
offset: 0.5,
color: 'rgba(254,153,59,0.7)'
},
{
offset: 1,
color: 'rgba(254,153,59,0.4)'
}
]), new echarts.graphic.LinearGradient(0, 0, 0, 1, [{
offset: 0,
color: '#12B252'
},
{
offset: 0.5,
color: 'rgba(18,187,82,0.7)'
},
{
offset: 1,
color: 'rgba(18,187,82,0.4)'
}
]), new echarts.graphic.LinearGradient(0, 0, 0, 1, [{
offset: 0,
color: '#0091FF'
},
{
offset: 0.5,
color: 'rgba(0,145,255,0.4)'
},
{
offset: 1,
color: 'rgba(0,145,255,0.4)'
}
])]
var data = {
xAxisData: ['1月', '2月', '3月', '4月', '5月', '6月'],
unit: '单位',
data: [{
data: [120, 200, 150, 80, 70, 110],
name: '登记管理'
}, {
data: [10, 46, 64, 0, 0, 0],
name: '简化管理'
}, {
data: [15, 25, 70, 50, 20, 150],
name: '重点管理'
}, ]
};
let tempData = JSON.parse(JSON.stringify(data));
if (this.chartData && this.chartData.data.length) {
data = this.chartData;
tempData = JSON.parse(JSON.stringify(this.chartData));
}
var series = data.data.map((item, index) => {
return {
...item,
stack: 'a',
color: colorList[index],
barWidth: 20,
type: 'bar',
itemStyle: {
color: colorList1[index]
}
}
});
const stackInfo = {};
for (let i = 0; i < series[0].data.length; ++i) {
for (let j = 0; j < series.length; ++j) {
const stackName = series[j].stack;
if (!stackName) {
continue;
}
if (!stackInfo[stackName]) {
stackInfo[stackName] = {
stackStart: [],
stackEnd: []
};
}
const info = stackInfo[stackName];
const data1 = series[j].data[i];
if (data1 && data1 !== '-') {
if (info.stackStart[i] == null) {
info.stackStart[i] = j;
}
info.stackEnd[i] = j;
}
}
}
for (let i = 0; i < series.length; ++i) {
const data1 = series[i].data;
const info = stackInfo[series[i].stack];
for (let j = 0; j < series[i].data.length; ++j) {
// const isStart = info.stackStart[j] === i;
const isEnd = info.stackEnd[j] === i;
const topBorder = isEnd ? 20 : 0;
const bottomBorder = 0;
data1[j] = {
value: data1[j],
itemStyle: {
// borderRadius: [topBorder, topBorder, bottomBorder, bottomBorder]
}
};
}
}
let tempSeries = JSON.parse(JSON.stringify(series));
for (var i = 0; i < tempData.data.length; i++) {
series.push({ // 圆柱上面的白色小盖子
name: tempData.data[i].name,
symbolOffset: [0, -6],
tooltip: {
show: false
},
type: 'pictorialBar',
itemStyle: {
normal: {
color: '#fff'
}
},
symbol: 'circle',
symbolSize: ['20', '10'],
symbolPosition: 'end',
data: this.getDataArraySum(tempData.data, i),
z: 3
})
series.push({ // 圆柱上面的蓝色(同色)小盖子
name: tempData.data[i].name,
symbolOffset: [0, -7],
tooltip: {
show: false
},
type: 'pictorialBar',
itemStyle: {
normal: {
color: colorList[i]
}
},
symbol: 'circle',
symbolSize: ['20', '10'],
symbolPosition: 'end',
data: this.getDataArraySum(tempData.data, i),
z: 3
})
}
this.myChart.setOption({
grid: {
right: 16,
left: 40
},
xAxis: {
type: 'category',
data: data.xAxisData
},
legend: {
itemHeight: 4,
itemWidth: 12,
backgroundColor: colorList,
right: 14,
top: 6,
textStyle: {
color: "#fff",
}
},
yAxis: {
type: 'value',
name: data.unit,
splitLine: {
lineStyle: {
color: 'rgba(255,255,255,0.2)'
}
}
},
series: series
});
},
getDataArraySum(data, dataIndex) {
debugger
let res = data[0].data;
for (var i = 0; i < dataIndex; i++) {
res = res.map((value, index) => value + data[i + 1].data[index]);
}
return res
}
},
computed: {},
watch: {
chartData: {
handler: function(val, oldVal) {
this.initChart();
},
deep: true
}
}
};
</script>
样式三(echarts)
<template>
	<div class="barContent">
		<div :id="props.chartclass" :style="{ width: '100%', height: '100%' }"></div>
	</div>
</template>
<script setup>
import {
markRaw,
onMounted,
ref,
watch,
onBeforeUnmount
} from "vue";
import * as echarts from "echarts";
const props = defineProps(["chartclass", "chartData"]);
// 初始化chart
let myChart = ref(null);
const resizeHandler = () => {
myChart.value.resize();
};
onMounted(() => {
let chartElement = document.getElementById(props.chartclass);
myChart.value = markRaw(echarts.init(chartElement));
initChart();
window.addEventListener("resize", resizeHandler);
});
onBeforeUnmount(() => {
window.removeEventListener("resize", resizeHandler);
myChart.value.dispose();
});
const initChart = () => {
switch (props.chartclass) {
case "kqzl": //首页-空气质量
initKqzl();
break;
}
};
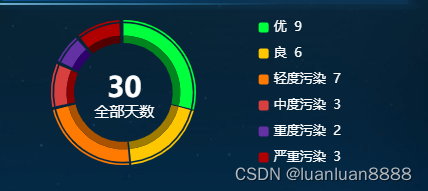
const initKqzl = () => {
// if (this.chartData && this.chartData.length) {}
const colorList1 = ["#00FF3C", "", "#FFC700", "", "#FF7A00", "", "#D83F3F", "", "#6331A3", "", "#B00000", ""];
const colorList2 = ["#00FF3C", "", "#FFC700", "", "#FF7A00", "", "#D83F3F", "", "#6331A3", "", "#B00000", ""];
const colorList3 = ["#00851F ", "", "#9F7C00", "", "#AA5200", "", "#8A0000", "", "#30006D", "", "#550000", ""];
let legendData = [],
sum = 0,
data1 = [];
var dataArr = [{
value: 9,
name: "优"
},
{
value: 6,
name: "良"
},
{
value: 7,
name: "轻度污染"
},
{
value: 3,
name: "中度污染"
},
{
value: 2,
name: "重度污染"
},
{
value: 3,
name: "严重污染"
},
];
dataArr.forEach((item) => {
legendData.push(item.name);
sum += Number(item.value || 0);
const _item = { ...item
};
if (!_item.value) {
_item.value = sum / 100;
}
data1.push(_item, {
name: "",
value: sum / 100,
label: {
show: false
},
itemStyle: {
color: "transparent",
},
});
});
var option = {
tooltip: {
trigger: "item",
},
title: [ //主副标题样式
{
left:'center',
text:'30',//主标题文本
top: "36.5%",
left: "25%",
textStyle: {
color: "#fff",
fontSize: 28,
fontWeight: 600,
},
itemGap: 5,
},
{
left:'center',
text:' 全部天数',//副标题文本
top: "55%",
left: "21%",
textStyle: {
color: "#fff",
fontSize: 15,
fontWeight: 400,
},
}
],
legend: {
orient: "vertical",
right: "18%",
top: "middle",
itemWidth: 10,
itemHeight: 10,
textStyle: {
color: "#ffffff",
fontSize: 13,
lineHeight: 16,
rich: {
text: {
fontSize: 13,
},
number: {
fontSize: 13,
// color: "#00C2FF",
fontWeight: "normal",
},
unit: {
fontSize: 13,
color: "#00C2FF",
},
},
},
data: legendData,
formatter(name) {
const newData = dataArr;
let tarValue = 0;
let total = 0;
for (let i = 0; i < newData.length; i++) {
total += newData[i].value;
if (newData[i].name === name) {
tarValue = newData[i].value;
}
}
var percert = total == 0 ? 0 : ((tarValue / total) * 100).toFixed(2);
const arr = name + " " + tarValue;
return `{text|${name}} {number|${tarValue}}`;
},
},
series: [{
type: "pie",
radius: ["86%", "88%"],
center: ["30%", "50%"],
minAngle: 0,
labelLine: {
show: false,
},
label: {
show: false,
alignTo: "labelLine",
position: "outside",
rich: {
name: {
color: "#ffffff",
fontSize: 12,
fontWeight: 400,
padding: [0, 0, 0, 10],
},
zb: {
color: "#fff",
fontWeight: 400,
fontSize: 12,
align: "left",
padding: [14, 0, 0, 24],
},
dot: {
backgroundColor: "auto",
width: 14,
height: 14,
padding: [0, 0, 0, 0],
verticalAlign: "top",
},
},
formatter: (params) => {
const x = params.dataIndex;
return "{dot|}" + "{name|" + params.data.name + "}" + "\n" + "{zb|" + params.data.value + "}";
},
},
itemStyle: {
normal: {
color: function(params) {
return colorList1[params.dataIndex];
},
},
},
data: data1,
z: 666,
},
{
type: "pie",
radius: ["69%", "84%"],
center: ["30%", "50%"],
hoverAnimation: false,
minAngle: 0,
emphasis: {
scale: false
},
// emphasis: {
// label: {
// show: true,
// fontSize: 40,
// fontWeight: 'bold'
// }
// },
label: {
show: false,
},
itemStyle: {
normal: {
color: function(params) {
return colorList2[params.dataIndex];
},
},
},
data: data1,
z: 1,
},
{
type: "pie",
radius: ["60%", "69%"],
center: ["30%", "50%"],
hoverAnimation: false,
minAngle: 0,
emphasis: {
scale: false
},
label: {
show: false,
},
itemStyle: {
normal: {
color: function(params) {
return colorList3[params.dataIndex];
},
},
},
data: data1,
z: 1,
},
],
};
myChart.value.setOption(option);
};
</script>
样式四(echarts)
<template>
  <div class="barContent">
    <div :id="props.chartclass" :style="{ width: '100%', height: '100%' }"></div>
  </div>
</template>
<script setup>
import { markRaw, onMounted, ref, watch, onBeforeUnmount } from "vue";
import * as echarts from "echarts";
const props = defineProps(["chartclass", "chartData"]);
// 初始化chart
let myChart = ref(null);
const resizeHandler = () => {
myChart.value.resize();
};
onMounted(() => {
let chartElement = document.getElementById(props.chartclass);
myChart.value = markRaw(echarts.init(chartElement));
initChart();
window.addEventListener("resize", resizeHandler);
});
onBeforeUnmount(() => {
window.removeEventListener("resize", resizeHandler);
myChart.value.dispose();
});
const initChart = () => {
switch (props.chartclass) {
case "kqzl": //首页-空气质量
initkqzl();
break;
case "jkzs": //首页-空气质量
initjkzs();
break;
case "kqrb": //首页-空气质量
initkqrb();
break;
}
};
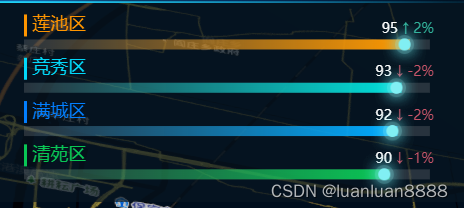
const initkqzl = () => {
var data = [
{
name: "莲池区",
value: 95,
sum: 2,
},
{
name: "竞秀区",
value: 93,
sum: -2,
},
{
name: "满城区",
value: 92,
sum: -2,
},
{
name: "清苑区",
value: 90,
sum: -1,
},
];
var colorArr = [
new echarts.graphic.LinearGradient(1, 0, 0, 0, [
{
offset: 1,
color: "#FF990000",
},
{
offset: 0,
color: "#FF9900",
},
]),
new echarts.graphic.LinearGradient(1, 0, 0, 0, [
{
offset: 1,
color: "#00E0DB00",
},
{
offset: 0,
color: "#00E0DB",
},
]),
new echarts.graphic.LinearGradient(1, 0, 0, 0, [
{
offset: 1,
color: "#00AAFF00",
},
{
offset: 0,
color: "#00AAFF",
},
]),
new echarts.graphic.LinearGradient(1, 0, 0, 0, [
{
offset: 1,
color: "#09C75500",
},
{
offset: 0,
color: "#09C755",
},
]),
];
data = data.sort((a, b) => {
return b.value - a.value;
});
var option = {
grid: {
top: "10%",
bottom: -15,
right: 0,
left: 40,
containLabel: true,
},
xAxis: {
show: false,
},
yAxis: [
{
triggerEvent: true,
show: true,
inverse: true,
data: getArrByKey(data, "name"),
axisLine: {
show: false,
},
splitLine: {
show: false,
},
axisTick: {
show: false,
},
axisLabel: {
show: false,
},
},
{
triggerEvent: true,
show: true,
inverse: true,
data: getArrByKey(data, "name"),
axisLine: {
show: false,
},
splitLine: {
show: false,
},
axisTick: {
show: false,
},
axisLabel: {
show: true,
interval: 0,
shadowOffsetX: "-20px",
color: "#FF9023",
align: "right",
verticalAlign: "bottom",
lineHeight: 30,
fontSize: 13,
formatter: function (value, index) {
if (data[index].sum > 0) {
return ` {color1|${data[index].value}}{value1|${" ↑ " + data[index].sum + "%"}} `;
} else {
return ` {color1|${data[index].value}}{value2|${" ↓ " + data[index].sum + "%"}} `;
}
},
rich: {
lg1: {
backgroundColor: " #D6FBE61A",
align: "center",
width: 3,
height: 22,
},
color1: {
color: "#fff",
fontSize: 14,
},
value1: {
color: "#31B099",
fontSize: 14,
},
value2: {
color: "#C65468",
fontSize: 14,
},
},
},
},
],
series: [
{
name: "XXX",
type: "pictorialBar",
symbol:
"image://data:image/png;base64,iVBORw0KGgoAAAANSUhEUgAAADoAAAA6CAMAAADWZboaAAAAZlBMVEUAAABe3uVe3+Vf3uVf3+Zf3uVg3+Zg3+Zf3+Vi4OZh4OZg3+Z86/Bh3+Zi4Odj4Odi4OZ86/B76/B86/Bj4ed56+9x5+xn4umB7/N87PB36e+A7/N+7fF/7vJ/7vJ+7fGA7/OB7/PReX+lAAAAIXRSTlMABQkVDREmIhk3MR10LEFFPHh7cUprXE35h2XnqMLAp+mHAG9cAAAB5ElEQVRIx83WjU7CMBQFYIoiKMqU/XUboHv/l/Tce7t2XamDNSacETEmX86tlK2rx4py150o+MstMBLwWRfHKo6JCVxLnvmFGBjFQ58oF1//sUZhGy/ClSTWObgnL4O+bkeN4nY2okfNMbkRt9/vtxz8InoTsWplJSCzFxPmO8+GpSIByX3YQAuGDWtRKhKjCnxDXhF6Z4yxnZ20Wgko7BMRDmxtSGVaI4kdTIgb+zTYoJQlIMlDlmUFgrcDWWC201qSayqlTkiCddWWeV62VU0YlnpRi9VOKaSUsiyq/N0krwq2Ugt7lVpZl5BfHNiytjagMi+XYp0kCR45hMlivVQrE/uU5pXSrCB5bM6d1t2lOZItMqmliT3q5uVxqxzyW/ccfYLNKx7ZTeykMvNyac2yt2Fbc61MHLSC0rwoxbiNdlQ3GBm1NLHQsHUrtEXppR/ljNpW6DbSCoqlFiVoN6YdaFlgsSFVPs1BdT8OaB5QyQzVcaqWDows/zepxR8ObLglTrdtCRVuRNj4Rrxh+//0ke2f8KVL+Kon3GCSbmsJN9OUW3j6g0Ns+LgCij2u0h+Sghc8mlMPBMgdx5DFh59VmOVHrvmDnoNxCz3J7MFWsMuaLyR089xz/xhlfijvwutR8gv3zk6BLUUeCgAAAABJRU5ErkJggg==",
symbolSize: [50, 50],
symbolOffset: [20, 0],
z: 12,
itemStyle: {
normal: {
color: function (params) {
var num = colorArr.length;
return colorArr[params.dataIndex % num];
},
},
},
data: getSymbolData(data),
},
{
name: "条",
type: "bar",
showBackground: true,
barBorderRadius: 30,
yAxisIndex: 0,
data: data,
barWidth: 10,
// align: left,
itemStyle: {
normal: {
color: function (params) {
var num = colorArr.length;
return colorArr[params.dataIndex % num];
},
},
// color: '#A71A2B',
barBorderRadius: 4,
},
label: {
normal: {
color: "#fff",
show: true,
position: [0, "-25px"],
textStyle: {
fontSize: 18,
},
formatter: function (a, b) {
return `{lg` + (a.dataIndex + 1) + `|} {color` + (a.dataIndex + 1) + `|${a.name}}`;
},
rich: {
lg1: {
backgroundColor: "#ff9500",
align: "center",
width: 3,
height: 22,
},
color1: {
color: "#ff9500",
fontSize: 18,
},
value1: {
color: "#ff9500",
fontSize: 18,
align: "right",
},
lg2: {
backgroundColor: "#02d8f9",
align: "center",
width: 3,
height: 22,
},
color2: {
color: "#02d8f9",
fontSize: 18,
},
lg3: {
backgroundColor: "#027fff",
align: "center",
width: 3,
height: 22,
},
color3: {
color: "#027fff",
fontSize: 18,
},
lg4: {
backgroundColor: "#09C755",
align: "center",
width: 3,
height: 22,
},
color4: {
fontSize: 18,
color: "#09C755",
},
},
},
},
},
],
};
myChart.value.setOption(option);
};
const getArrByKey = (data, k) => {
let key = k || "value";
let res = [];
if (data) {
data.forEach(function (t) {
res.push(t[key]);
});
}
return res;
};
const getSymbolData = (data) => {
let arr = [];
for (var i = 0; i < data.length; i++) {
arr.push({
value: data[i].value,
symbolPosition: "end",
});
}
return arr;
};
watch(props.chartData, (val, oldVal) => {
initChart();
});
</script
<style>
.barContent {
height: 100%;
width: 100%;
}
</style>
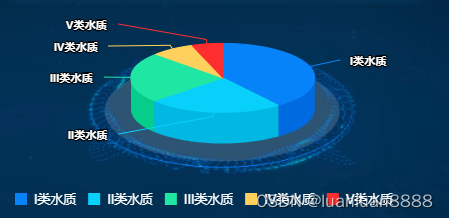
样式五(使用highCharts)
/* 使用highCharts*/
<template>
	<!--  :style="{ width: '100%', height: '100%' }" -->
	<div id="container" :style="{ width: '100%', height: '100%' }"></div>
	<!-- 底座背景 -->
	<div class="bg"></div>
</template>
<script>
	import {
		reactive,
		toRefs,
		ref,
		onMounted
	} from 'vue'
	import Highcharts from 'highcharts' //必须引入
	import Highcharts3D from 'highcharts/highcharts-3d' // 3D必须有引入
	import backgrounCharts from '../../assets/HomeView/backgrounCharts.png'
	Highcharts3D(Highcharts)
	export default {
		setup() {
			let pie = ref('')
			let state = reactive({})

			onMounted(() => {
				let colors = ['#0783FA', '#07D1FA', '#20E6A4', '#FFD15C', '#FF2E2E']
				Highcharts.setOptions({
					colors: colors
				})
				Highcharts.chart(
					'container', {
						credits: {
							enabled: false, // 默认值,如果想去掉版权信息,设置为false即可
						},
						chart: {
							spacing: [20, 0, 20, 0],
							options3d: {
								enabled: true,
								alpha: 68 // 旋转角度
							},
							backgroundColor: "rgba(0, 0, 0, 0)", // 不显示背景色
							style: {
								marginBottom: 0,
							},
						},
						legend: {
							itemStyle: {
								//图例文字的样式
								color: "#999",
								fontSize: 10,
							},
							left: "center",
							itemWidth: 10,
							selectedMode: false,
							data: ['I类水质', 'II类水质', 'III类水质', 'IV类水质', 'V类水质']
						},
						title: {
							text: ''
						},
						tooltip: {
							pointFormat: '{series.name}: <b>{point.percentage:.1f}%</b>'
						},
						plotOptions: {
							pie: {
								allowPointSelect: true,
								cursor: 'pointer',
								depth: 45,

								dataLabels: {
									enabled: true,
									distance: 22,
									format: '{point.name}'
								}
							}
						},
						legend: {
							enabled: true,    // 打开图例
							itemHoverStyle: {     // 图例鼠标划过时样式
								color: '#fff'
							},
							itemStyle: {   // 图例样式
								color: '#fff'
							},
							symbolRadius: 0, // 图例项标示圆角
							itemDistance: 10, // 图例项间距
							align: 'left',
							floating: true,    //图例是否浮动,设置浮动后,图例将不占位置
							y: 20,
						},
						series: [{
							size: '126%',
							center: ["51%", "26%"],  // 调整饼图位置
							type: 'pie',
							name: '占比',
							showInLegend: true, // 默认值
							data: [
								['I类水质', 45.0],
								['II类水质', 26.8],
								['III类水质', 26.8],
								['IV类水质', 8.5],
								['V类水质', 6.2],
							]
						}]
					},
				)
			})
			return {
				...toRefs(state),
				pie
			}
		}
	}
</script>

<style lang="scss" scoped>
	:deep #container>div>svg>.highcharts-background {
		fill: rgb(255, 0, 0, 0) !important;
	}

	.pie {
		width: 100%;
		height: 100%;
	}


	.bg {
		z-index: -1;
		width: 66%;
		height: 70%;
		margin-top: -42%;
		margin-left: 18%;
		position: relative;
		background-image: url("../../assets/HomeView/backgrounCharts.png");
		background-size: 100% 100%;
	}
</style>
样式六(使用eCharts)

<template>
	<div class="barContent">
		<div :id="props.chartclass" :style="{ width: '100%', height: '100%' }"></div>
	</div>
</template>
<script setup>
	import {
		markRaw,
		onMounted,
		ref,
		watch,
		onBeforeUnmount
	} from "vue";
	import * as echarts from "echarts";
	const props = defineProps(["chartclass", "chartData"]);
	// 初始化chart
	let myChart = ref(null);

	const resizeHandler = () => {
		myChart.value.resize();
	};
	onMounted(() => {
		let chartElement = document.getElementById(props.chartclass);
		myChart.value = markRaw(echarts.init(chartElement));
		initChart();
		window.addEventListener("resize", resizeHandler);
	});
	onBeforeUnmount(() => {
		window.removeEventListener("resize", resizeHandler);
		myChart.value.dispose();
	});

	const initChart = () => {
		switch (props.chartclass) {
			case "kqzl": //首页-空气质量
				initKqzl();
				break;
		}
	};

	const initKqzl = () => {
			var option = {
					series: [{
						type: 'gauge',
						radius: 56,
						progress: {
							show: true,
							width: 8
						},
						axisTick: {
							show: false,
						},
						axisLine: {
							lineStyle: {
								width: 16
							}
						},
						splitLine: {
							show: false,
						},
						itemStyle: {

							// show: false,
							color: new echarts.graphic.LinearGradient(0, 0, 0, 1, [{
									offset: 0,
									color: '#f9ab05'
								},
								{
									offset: 0.5,
									color: '#90ce5b'
								},
								{
									offset: 1,
									color: '#05fdcd'
								}
							])
						},
						// axisLabel: {
						// 	show: false,
						// },
						detail: {
							valueAnimation: true,
							width: '60%',
							lineHeight: 40,
							borderRadius: 8,
							offsetCenter: [0, '-5%'],
							fontSize: 20,
							fontWeight: 'bolder',
							formatter: 'PM2.5',
							color: '#fff'
						},
						pointer: {
							show: false,
						},
						title: { // 设置仪表盘中间显示文字样式
							offsetCenter: [0, '60%'],
							textStyle: { // 其余属性默认使用全局文本样式,详见TEXTSTYLE
								fontWeight: 'bolder',
								fontSize: 14,
								color: '#235C8A'
							}
						},
						data: [{
							value: 30,
							name: '',
							title: {
								fontSize: 14,
								color: '#fff',
							}
						}]
					}]
				}
			myChart.value.setOption(option);
		};


</script>

<style>
	.barContent {
		height: 100%;
		width: 100%;
	}
</style>
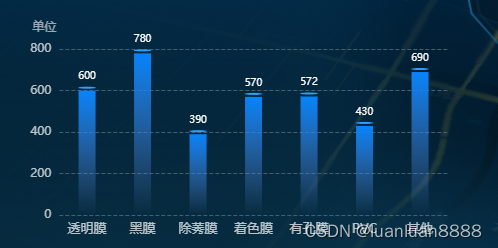
样式七(使用eCharts)
<template>
    <!-- 纵向柱状图 -->
    <div ref="myChart" :chartData="chartData" :id="id" :class="className" :style="{ height: height, width: width }" />
</template>
<script>
import * as echarts from "echarts";
export default {
    props: {
        className: {
            type: String,
            default: "chart",
        },
        id: {
            type: String,
            default: "chart",
        },
        width: {
            type: String,
            default: "10rem",
        },
        height: {
            type: String,
            default: "10rem",
        },
        chartData: {
            type: Array,
            default: null,
        },
    },
    data() {
        return {
            chart: null,
        };
    },
    created() {
        this.$nextTick(() => {
            setTimeout(() => {
                this.getDataFun();
            }, 300);
        });
    },
    mounted() {
        let _this = this;
        this.chart = echarts.init(document.getElementById(this.id));
        window.addEventListener("resize", function () {
            if (this.chart) { }
            setTimeout(() => {

                console.log(_this.chart)
                _this.chart.clear();
                _this.chart.resize({});
                _this.getDataFun();
            }, 300);
        });
    },
    beforeDestroy() {
        if (!this.chart) {
            return;
        }
        this.chart.dispose();
        this.chart = null;
    },
    watch: {
        chartData: {
            handler: function (val) {
                if (val) {
                    this.getDataFun();
                }
            },
            deep: true,
            // immediate: true,
        }
    },
    methods: {
        getDataFun() {
            // if (this.chartData && this.chartData.length) {}
            const resultData = [
                { value: 600, name: '透明膜' },
                { value: 780, name: '黑膜' },
                { value: 390, name: '除莠膜' },
                { value: 570, name: '着色膜' },
                { value: 572, name: '有孔膜' },
                { value: 430, name: 'PVC' },
                { value: 690, name: '其他' },
            ]
            this.chart.setOption({
                dataZoom: [
                    {
                        type: 'slider', // 内置在坐标系中
                        height: 0,
                        zoomLock: true,
                        realtime: true,
                        show: false,
                        startValue: 0, // 从头开始。
                        endValue: 10, // 一次性展示 10个。
                    },
                ],
                tooltip: {
                    trigger: 'axis',
                    formatter(param) {
                        let html = ''
                        if (param.length > 0) {
                            const { value, marker } = param[0]
                            html += `${marker}${value.name}:${value.value}个`
                        }
                        return html
                    },
                },
                grid: {
                    top: '25%',
                    bottom: '0%',
                    left: '5%',
                    right: '5%',
                    containLabel: true,
                },
                dataset: [
                    {
                        source: resultData,
                        dimensions: ['name', 'value'],
                    },
                ],
                xAxis: [
                    {
                        type: 'category',
                        axisLabel: {
                            interval: 0,
                            color: 'rgba(255, 255, 255, 0.72)',
                            fontSize: 13,
                            rotate: this.xRotate ? this.xRotate : 0,
                            formatter(val) {
                                const name = val.length > 6 ? `${val.substr(0, 5)}..` : val
                                return name
                            },
                        },
                        axisLine: {
                            show: false,
                            lineStyle: {
                                color: 'rgba(255, 255, 255, 0.4)',
                            },
                        },
                        axisTick: {
                            show: false,
                        },
                        axisPointer: {
                            type: 'shadow',
                        },
                    },
                ],
                yAxis: [
                    {
                        name: '单位',
                        type: 'value',
                        nameTextStyle: {
                            color: 'rgba(255, 255, 255, 0.60)',
                            padding: [0, 0, 0, -30],
                        },
                        axisTick: {
                            show: false,
                        },
                        axisLine: {
                            show: false,
                            lineStyle: {
                                color: 'rgba(255, 255, 255, 0.4)',
                            },
                        },
                        axisLabel: {
                            interval: 0,
                            color: 'rgba(255, 255, 255, 0.72)',
                        },
                        splitLine: {
                            show: true,
                            lineStyle: {
                                type: 'dashed',
                                color: '#465F6C ',
                            },
                        },
                    },
                ],
                series: [

                    {
                        //柱体
                        name: '',
                        type: 'bar',
                        barWidth: 17,
                        barGap: '0%',
                        itemStyle: {
                            normal: {
                                color: {
                                    x: 0,
                                    y: 0,
                                    x2: 0,
                                    y2: 1,
                                    type: 'linear',
                                    global: false,
                                    colorStops: [
                                        { offset: 1, color: '#6C95E600' },
                                        { offset: 0, color: '#0783FAff' },
                                    ],
                                },
                            },
                        },
                        encode: {
                            x: 'name',
                            y: 'value',
                        },
                    },
                    {
                        //柱子顶部
                        name: '',
                        type: 'pictorialBar',
                        symbolSize: [17, 2],   // 控制柱子的长高 [长度,高度]
                        symbolOffset: [0, -4], // 控制两个柱子之间的间距
                        symbolPosition: 'end',
                        label: { // 控制数字在柱子的上面显示
                            show: true,
                            position: 'top',
                            textStyle: {
                                fontSize: 10,
                                color: '#fff',
                            },
                        },
                        itemStyle: {
                            normal: {
                                color: '#2FA0FF',
                            },
                        },
                        encode: {
                            x: 'name',
                            y: 'value',
                        },
                    },
                ],
            });
        },
    },
};
</script>
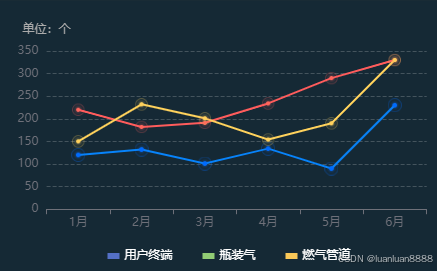
样式八(使用eCharts)
ps: 需要使用symbol、symbolSize属性,symbol需要将图片转换为DataURL格式
转换地址:在线转换生成DataURL(DataUri)、图片转DataURL、支持JPG,PNG,GIF,WEBP等
<template>
    <!-- 自定义拐点图片 折线图 -->
    <div :id="props.chartclass" :style="{ width: '100%', height: '100%' }"></div>
</template>
<script setup>
import { markRaw, onMounted, ref, watch, onBeforeUnmount, nextTick } from "vue";
import * as echarts from "echarts";
const props = defineProps(["chartclass", "chartData"]);
// 初始化chart
let myChart = ref(null);

const resizeHandler = () => {
    myChart.value.resize();
};
onMounted(() => {
    let chartElement = document.getElementById(props.chartclass);
    chartElement.removeAttribute('_echarts_instance_')
    myChart.value = markRaw(echarts.init(chartElement));
    initChart();
    window.addEventListener("resize", resizeHandler);

});

onBeforeUnmount(() => {
    window.removeEventListener("resize", resizeHandler);
    myChart.value.dispose();
});


const initChart = () => {

    switch (props.chartclass) {
        case "yjqsfx_halfYear": //首页-预警趋势分析
            initYjqsfx();
            break;

    }
};

const initYjqsfx = () => {
    var option = {
        legend: {
            bottom: "0",
            icon: 'rect',
            itemGap: 30, // 图例间距
            itemHeight: 6,
            itemWidth: 12,
            textStyle: {
                color: '#fff'
            },
            data: ['用户终端', '瓶装气', '燃气管道'],
        },
        grid: {
            left: '5%',
            right: '8%',
            bottom: '14%',
            top: '20%',
            containLabel: true
        },
        xAxis: {
            type: 'category',
            data: ['1月', '2月', '3月', '4月', '5月', '6月']
        },
        yAxis: {
            type: 'value',
            minInterval: 1,  // 设置最小刻度间隔为1
            name: "单位:个",
            nameTextStyle: {
                color: "#aaa",
                nameLocation: "start",
            },
            splitLine: {
                show: true,
                lineStyle: {
                    color: 'rgba(255, 255, 255, 0.2)',
                    type: 'dashed'
                }
            },
        },
        series: [
            {
                name: '用户终端',
                type: 'line',
                symbol: 'image://data:image/png;base64,iVBORw0KGgoAAAANSUhEUgAAAA8AAAAPCAYAAAA71pVKAAAACXBIWXMAAAsTAAALEwEAmpwYAAAAAXNSR0IArs4c6QAAAARnQU1BAACxjwv8YQUAAAJeSURBVHgBnZPPatRQFMa/e3PzbzKT1mqVllan1FULVagKBXHjM/QVuhEXrtzJ4MaloAvBhQ9Qn0FQBKXVLhQsLloddRzB0plOmplMcm/u9SRSbYsrs7l/zvdLzjnfCcPx56aZgsY0GEIY2LRKWiNwfMND1josZX92K6ZC0ku0k4HB5/4OOpiHQhsW3Z0SHmZUDp9e9RqP2aBAeAneMr6wsURwa/kn1guwPg8+gbaHSYInsXt1DOukbqLQkf7vl2+Y6y4F0nTjK7Boh0Hk5cJyDAs4M30trCDtdZAWWcHFWVonqYSX7KDGxjjWHsXw+3EccMceUTyvCccWLJPKaLWvHd6Lo2pMWIYdXC56wMvmUI2rgEjyyJW+HUrGLibKfxL1xVok/VWpvQXO7JEiI+xuWRVJ6RPHy66eRmfQBHdF6PiK14a5fc8YXCgqMsDs0Ig7asirRbx+8jwbdLFbcLy0owHZPNFihg245nAInD1siQFbEC4c7SRWs0dY4QJxvPRxBQJdZZipaMakZDDvj7m/rTQyZoyeosPcB9ITx8sBIB/Rr+vMQmpYJfKEuUvB7dIOhne+kLeF0ftZotLWxy29eYb0xB3pdqMNr+oi4F46yqlGzZXjOEZmyooi7u5N1DD4MUeWvcCVotsHPl+j5L+TDV9oopwwjzynJtz+kHFe83NLRVk0Eg4X25AbFUwLTdP2gD37PWESb6ltdbeNc+gijabDuDpa6Sa+3xkPsEdgjOfICpDUdWXh1b9me4lqSej0iQah03gKtboMsVnHGAaYoXsbDt7gPkuOwv/xV/0CKWoPC98obXoAAAAASUVORK5CYII=',
                symbolSize: 14,
                // 设置折线颜色
                lineStyle: {
                    color: '#0783FA',
                    width: 2,
                    type: 'solid'
                },
                data: [120, 132, 101, 134, 90, 230]
            },
            {
                name: '瓶装气',
                type: 'line',
                symbol: 'image://data:image/png;base64,iVBORw0KGgoAAAANSUhEUgAAABEAAAARCAYAAAA7bUf6AAAACXBIWXMAAAsTAAALEwEAmpwYAAAAAXNSR0IArs4c6QAAAARnQU1BAACxjwv8YQUAAAJwSURBVHgBjVO7bhNBFL07O7v2Zh2bJV3iGAoU2hRUFPxDmhRIyQckP4BEhUTBD6SgSGVR5SfSABI0qRGRYG3kzrFjr72PmR3O3HWQbRDKSLNzd/eec899DNHaMkQOn8Y41uYNm/6z/vxkR8exBtHx8S4+dbCbJISkslSwb7Fj6nZ7S2DzN8nhYUhh+AwvJYA9CoIhzeeK0lTS1lZESfII32uU55/o4iJZIWGC09MQTs8ZXJa/qF6XcJaklENSGvJ9S6ZAvENZ1oH98Y7I5Ro4yGMweMHg6XQANQEcN8AekusGHN3zLKmD9Eas1POe0sHBzzeXl0awpOvrNpwziOqD0Gew7zfxHsGO+CyKFsgasOsgsH6acViClQixi8gxyw+CAClskFB7FIr3FDqfcX4gyveoVguZZDLxQBJbnMWLqsxOi7S+geXihweSOqx3oN9ftOEJ1eRrJlBKcr2KYgiVTZtJRVL9UNRqCZAIpCIYuDoM+xzEbltsITSCe5USOxdSKuTrQo1tbYnToFJXa1P4HU/N/223gkACW7ASNMZA2hjAh+iMRm1yKJnD/e0CSEyY61fwS/GWc6u1fgAldgBJspMQPbA/hswrRMpQ4ARE3ygrXi5S0HBKqVQz+KY8M0rZwfvBcCbpdvuQZp3bmNAMEWcgukWkG7R+yKcQY9rcnAKcwt7h4i+ugLibeewvUNOmKNpGpBnIpkhtjHaO+NR6gsgzNGCb75UdfWNWLyBznZw0ePRt7r4f49MI4ILvjutGUNBBIJcaja90dpZwPddJqhpC3dFRmwfQzo8x1S226UjZp/PzePkG33uZfwRbXr8Bk5dGgLKi+lcAAAAASUVORK5CYII=',
                symbolSize: 14,
                // 设置折线颜色
                lineStyle: {
                    color: '#FF5C5C',
                    width: 2,
                    type: 'solid'
                },

                data: [220, 182, 191, 234, 290, 330]
            },
            {
                name: '燃气管道',
                symbol: 'image://data:image/png;base64,iVBORw0KGgoAAAANSUhEUgAAABEAAAARCAYAAAA7bUf6AAAACXBIWXMAAAsTAAALEwEAmpwYAAAAAXNSR0IArs4c6QAAAARnQU1BAACxjwv8YQUAAAKvSURBVHgBjZS7jhxFFIa/qq6+zM54zQABsnfXBJYRbOKAiIB3QLIIkOAB4AWQCACJgBdAiIDIIoKHcAJIkGyAEwQSzK5lOdmLdy59qYv/7tm15bVs+QR9qzp/nf8//2m4EClh1vdkEpj+vX/mBWGeJGujMQMKdz/ZxrODZRNrHTF6PT/Uthm7t/cfJxvSsyB3PxyTjd+lS5EU95mMDpmvPF3tGL82pVtcw8QS0/7G7s+Lp0DWAJ+NSYv3QMlVvEdTOULrsN4QXSIrPGXtSaOrLJsdXP3rOVDW81Zdhrfvv0+n5DS/z2I8IjUbgh9DNhKdkjx3dK2hscc4VWryt/j+g/+/vnMn2V4Fbv27JbyGlgOsKRgp2RWb5Ey1PNUxU0J3mSZO9K3ijfyAaMKQp7BDJdhtQjNjovLDSFX4DdG4QbA/aPl3ifuTqrhBWY7pBPLgNCc3M5zd7rtnB1WjuUwIR6oko7A5wVdEvtXKzbXqXCdzX+i4itzrIOnlukNC2uw1ccMmq4W8UhvLCt9aisLi0/ULdrgp4EyAGSuJjQtkJj+rRISs82zEjCpEXIwsQ9+6vQuO+kdeCay0PlK3JiMnG3Z9JRJWxozdCfPwKs08QNNSFiulfTMkrmOPFD4ndbXsJ9JqtQmvkExvQNZ0sPvi/Cal36OODbQLTPE3tvtIZ2eioautwS8ldk0lz8z9NWz8b8geMH65rdamjIYt/Kqh7pa4VqeYI7X+UMIfqUMncGlO42tqexUj8c9GYA3ypeR5Pf0hnbfIp1eIxZLT1Zy2OWFxeozR/VI4JY9LyuqKaO4M1l+7nqemM/316WSwfs89FDN9OsaGbpidLJuKkobSZTD5k93vZHmTngEZgL5Sdbc+3hoM2PvHprMpFh3rDnjnx1lfwPnwvXSc/2OeF48AvepCFkxxhokAAAAASUVORK5CYII=',
                symbolSize: 14,
                type: 'line',
                // 设置折线颜色
                lineStyle: {
                    color: '#FFD15C',
                    width: 2,
                    type: 'solid'
                },
                data: [150, 232, 201, 154, 190, 330]
            }
        ]
    };
    myChart.value.setOption(option);
};
watch(props.chartData, (val, oldVal) => {
    initChart();
});

</script>
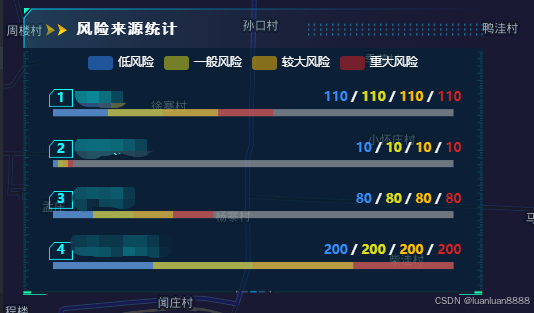
样式九(使用eCharts)
<template>
    <!-- 自定义拐点图片 折线图 -->
    <div :id="props.chartclass" :style="{ width: '100%', height: '100%' }"></div>
</template>
<script setup>
import { markRaw, onMounted, ref, watch, onBeforeUnmount, nextTick } from "vue";
import * as echarts from "echarts";
const props = defineProps(["chartclass", "chartData"]);
// 初始化chart
let myChart = ref(null);
const resizeHandler = () => {
myChart.value.resize();
};
onMounted(() => {
let chartElement = document.getElementById(props.chartclass);
chartElement.removeAttribute('_echarts_instance_')
myChart.value = markRaw(echarts.init(chartElement));
initChart();
window.addEventListener("resize", resizeHandler);
});
onBeforeUnmount(() => {
window.removeEventListener("resize", resizeHandler);
myChart.value.dispose();
});
const initChart = () => {
switch (props.chartclass) {
case "yjqsfx_halfYear":
initYjqsfx();
break;
}
};
const initYjqsfx = () => {
let data = {
dfxData: {
name: '低风险',
data: [
{
name: 'XXXXXXXXX1',
value: '110'
},
{
name: 'XXXXXXXXX2',
value: '10'
},
{
name: 'XXXXXXXXX3',
value: '80'
},
{
name: 'XXXXXXXXX4',
value: '200'
},
]
},
ybData: {
name: '一般风险',
data: [
{
name: 'XXXXXXXXX1',
value: '110'
},
{
name: 'XXXXXXXXX2',
value: '10'
},
{
name: 'XXXXXXXXX3',
value: '80'
},
{
name: 'XXXXXXXXX4',
value: '200'
},
]
},
jdData: {
name: '较大风险',
data: [
{
name: 'XXXXXXXXX1',
value: '110'
},
{
name: 'XXXXXXXXX2',
value: '10'
},
{
name: 'XXXXXXXXX3',
value: '80'
},
{
name: 'XXXXXXXXX4',
value: '200'
},
]
},
zdData: {
name: '重大风险',
data: [
{
name: 'XXXXXXXXX1',
value: '110'
},
{
name: 'XXXXXXXXX2',
value: '10'
},
{
name: 'XXXXXXXXX3',
value: '80'
},
{
name: 'XXXXXXXXX4',
value: '200'
},
]
},
}
var option = {
grid: {
top: "16%",
bottom: -18,
right: -120,
left: 30,
containLabel: true,
},
legend: {
textStyle: {
color: "#ffffff",
fontSize: 12,
lineHeight: 20,
}
},
xAxis: {
show: false,
},
yAxis: [
{
triggerEvent: true,
show: true,
inverse: true,
data: getArrByKey(data.dfxData.data, "name"),
axisLine: {
show: false,
},
splitLine: {
show: false,
},
axisTick: {
show: false,
},
axisLabel: {
show: false,
},
},
{
triggerEvent: true,
show: true,
inverse: true,
data: getArrByKey(data.dfxData.data, "name"),
axisLine: {
show: false,
},
splitLine: {
show: false,
},
axisTick: {
show: false,
},
axisLabel: {
show: true,
interval: 0,
shadowOffsetX: "-20px",
color: "#FF9023",
align: "right",
verticalAlign: "bottom",
lineHeight: 30,
fontSize: 13,
formatter: function (value, index) {
if (data.dfxData.data[index].sum > 0) {
return ` {color1|${data.dfxData.data[index].value}} `;
} else {
return ` {color1|${data.dfxData.data[index].value}} {color|/} {color2|${data.ybData.data[index].value}} {color|/} {color3|${data.jdData.data[index].value}} {color|/} {color4|${data.zdData.data[index].value}}`;
}
},
rich: {
color: {
color: "#FFFFFF",
fontSize: 13,
fontWeight: 600,
},
color1: {
color: "#338EFF",
fontSize: 13,
fontWeight: 600,
},
color2: {
color: "#E0E019",
fontSize: 13,
fontWeight: 600,
},
color3: {
color: "#FFC004",
fontSize: 13,
fontWeight: 600,
},
color4: {
color: "#DF2121",
fontSize: 13,
fontWeight: 600,
},
},
},
},
],
series: [
{
stack: 'total',
name: "低风险",
type: "bar",
showBackground: true,
barBorderRadius: 30,
yAxisIndex: 0,
data: data.dfxData.data,
barWidth: 7,
itemStyle: {
normal: {
color: '#338EFF80'
},
barBorderRadius: 4,
},
label: {
normal: {
color: "#fff",
show: true,
position: ['-4px', "-20px"],
textStyle: {
fontSize: 18,
},
formatter: function (a, b) {
return `{color|${' ' + (a.dataIndex + 1) + ' '}} {value|${a.name}}`;
},
rich: {
color: {
color: "#10FCFF",
fontSize: 13,
fontWeight: 600,
backgroundColor: {
image: new URL('../../assets/RiskAndDangers/fxlytjBg.png', import.meta.url).href,
repeat: 'no-repeat', // 背景图片不重复
// position:['0', '-2px']
},
width: '32', // 宽度设置为 100%
height: '18', // 高度设置为 100%
align:'center'
},
value: {
color: "#10FCFF",
fontSize: 13,
align: "right",
},
color2: {
color: "#E3E9F3",
fontSize: 13,
},
color3: {
color: "#E3E9F3",
fontSize: 13,
},
color4: {
fontSize: 13,
color: "#E3E9F3",
},
},
},
},
},
{
stack: 'total',
name: "一般风险",
type: "bar",
showBackground: true,
barBorderRadius: 30,
yAxisIndex: 0,
data: data.ybData.data,
barWidth: 10,
itemStyle: {
normal: {
color: '#E0E01980'
},
barBorderRadius: 4,
},
},
{
stack: 'total',
name: "较大风险",
type: "bar",
showBackground: true,
barBorderRadius: 30,
yAxisIndex: 0,
data: data.jdData.data,
barWidth: 10,
itemStyle: {
normal: {
color: '#FFC00480'
},
barBorderRadius: 4,
},
},
{
stack: 'total',
name: "重大风险",
type: "bar",
showBackground: true,
barBorderRadius: 30,
yAxisIndex: 0,
data: data.zdData.data,
barWidth: 10,
itemStyle: {
normal: {
color: '#DF212180'
},
barBorderRadius: 4,
},
},
],
};
myChart.value.setOption(option);
};
const getArrByKey = (data, k) => {
let key = k || "value";
let res = [];
if (data) {
data.forEach(function (t) {
res.push(t[key]);
});
}
return res;
};
watch(props.chartData, (val, oldVal) => {
initChart();
});
</script>


 被折叠的 条评论
为什么被折叠?
被折叠的 条评论
为什么被折叠?
 到【灌水乐园】发言


