


引言
脱发现象的普遍性及其对个人心理和社会生活的影响
传统脱发治疗方法与局限性
技术介入(数据分析、机器学习)在脱发预测与干预中的潜力
pip install pyecharts
Collecting pyecharts
  Downloading pyecharts-2.0.8-py3-none-any.whl (153 kB)
     ------------------------------------ 153.7/153.7 kB 328.3 kB/s eta 0:00:00
Requirement already satisfied: jinja2 in c:\programdata\anaconda3\lib\site-packages (from pyecharts) (3.1.2)
Collecting simplejson
  Downloading simplejson-3.20.1-cp310-cp310-win_amd64.whl (75 kB)
     ---------------------------------------- 75.7/75.7 kB 1.4 MB/s eta 0:00:00
Collecting prettytable
  Downloading prettytable-3.16.0-py3-none-any.whl (33 kB)
Requirement already satisfied: MarkupSafe>=2.0 in c:\programdata\anaconda3\lib\site-packages (from jinja2->pyecharts) (2.1.1)
Requirement already satisfied: wcwidth in c:\programdata\anaconda3\lib\site-packages (from prettytable->pyecharts) (0.2.5)
Installing collected packages: simplejson, prettytable, pyecharts
Successfully installed prettytable-3.16.0 pyecharts-2.0.8 simplejson-3.20.1
Note: you may need to restart the kernel to use updated packages.
脱发的主要影响因素 ◦ 遗传因素:家族史、特定基因(如AR基因)的作用 ◦ 激素水平:DHT(二氢睾酮)与雄激素性脱发的关系 ◦ 营养缺乏:铁、锌、维生素D等关键营养素的影响 ◦ 生活方式:压力、睡眠不足、吸烟与饮酒的关联 ◦ 环境因素:水质、空气污染、紫外线暴露 ◦ 疾病与药物:甲状腺疾病、化疗药物的副作用
import pandas as pd
import matplotlib.pyplot as plt
import numpy as np
from sklearn.model_selection import train_test_split #划分训练集和测试集
from sklearn.ensemble import RandomForestClassifier  #随机森林
from sklearn.preprocessing import LabelEncoder
from sklearn.metrics import classification_report, roc_curve, auc, confusion_matrix  #模型评估
from sklearn.svm import SVC  #支持向量机

import warnings
warnings.filterwarnings('ignore') #忽略警告信息

plt.rcParams['font.sans-serif']='SimHei'
plt.rcParams['axes.unicode_minus']=False
数据收集与特征工程
临床数据:激素检测结果、头皮健康指标(毛囊密度)
基因组数据:SNP(单核苷酸多态性)分析与风险评分
生活习惯数据:问卷调查(饮食、作息、压力水平)
环境数据:居住地水质报告、空气质量指数
特征选择方法:相关性分析、主成分分析(PCA)
#数据读取
df=pd.read_csv('Predict Hair Fall.csv')
df
| Id | Genetics | Hormonal Changes | Medical Conditions | Medications & Treatments | Nutritional Deficiencies | Stress | Age | Poor Hair Care Habits | Environmental Factors | Smoking | Weight Loss | Hair Loss | |
|---|---|---|---|---|---|---|---|---|---|---|---|---|---|
| 0 | 133992 | Yes | No | No Data | No Data | Magnesium deficiency | Moderate | 19 | Yes | Yes | No | No | 0 |
| 1 | 148393 | No | No | Eczema | Antibiotics | Magnesium deficiency | High | 43 | Yes | Yes | No | No | 0 |
| 2 | 155074 | No | No | Dermatosis | Antifungal Cream | Protein deficiency | Moderate | 26 | Yes | Yes | No | Yes | 0 |
| 3 | 118261 | Yes | Yes | Ringworm | Antibiotics | Biotin Deficiency | Moderate | 46 | Yes | Yes | No | No | 0 |
| 4 | 111915 | No | No | Psoriasis | Accutane | Iron deficiency | Moderate | 30 | No | Yes | Yes | No | 1 |
| ... | ... | ... | ... | ... | ... | ... | ... | ... | ... | ... | ... | ... | ... |
| 994 | 184367 | Yes | No | Seborrheic Dermatitis | Rogaine | Vitamin A Deficiency | Low | 33 | Yes | Yes | Yes | Yes | 1 |
| 995 | 164777 | Yes | Yes | No Data | Accutane | Protein deficiency | Low | 47 | No | No | No | Yes | 0 |
| 996 | 143273 | No | Yes | Androgenetic Alopecia | Antidepressants | Protein deficiency | Moderate | 20 | Yes | No | Yes | Yes | 1 |
| 997 | 169123 | No | Yes | Dermatitis | Immunomodulators | Biotin Deficiency | Moderate | 32 | Yes | Yes | Yes | Yes | 1 |
| 998 | 127183 | Yes | Yes | Psoriasis | Blood Pressure Medication | Vitamin D Deficiency | Low | 34 | No | Yes | No | No | 1 |
999 rows × 13 columns
预测模型构建
机器学习方法:
逻辑回归:用于二分类(脱发/非脱发)预测
随机森林:处理高维特征并评估变量重要性
支持向量机(SVM):解决非线性分类问题
深度学习模型:
CNN(卷积神经网络)分析头皮图像(如毛囊显微镜照片)
RNN(循环神经网络)处理时间序列数据(如激素水平变化)
模型评估指标:准确率、召回率、AUC-ROC曲线
# 将列名转换成中文,便于理解
chinese_columns=[
    '遗传因素',
    '荷尔蒙变化',
    '医疗状况',
    '药物及治疗',
    '营养缺乏',
    '压力水平',
    '年龄',
    '不良护发习惯',
    '环境因素',
    '吸烟习惯',
    '体重减轻',
    '脱发标记'   # 目标变量
]


# 将原始数据集的列名改为:第一列为'ID',后面依次为chinese_columns中的12个列名
df.columns = ['ID'] + chinese_columns
df.head(5)
| ID | 遗传因素 | 荷尔蒙变化 | 医疗状况 | 药物及治疗 | 营养缺乏 | 压力水平 | 年龄 | 不良护发习惯 | 环境因素 | 吸烟习惯 | 体重减轻 | 脱发标记 | |
|---|---|---|---|---|---|---|---|---|---|---|---|---|---|
| 0 | 133992 | Yes | No | No Data | No Data | Magnesium deficiency | Moderate | 19 | Yes | Yes | No | No | 0 |
| 1 | 148393 | No | No | Eczema | Antibiotics | Magnesium deficiency | High | 43 | Yes | Yes | No | No | 0 |
| 2 | 155074 | No | No | Dermatosis | Antifungal Cream | Protein deficiency | Moderate | 26 | Yes | Yes | No | Yes | 0 |
| 3 | 118261 | Yes | Yes | Ringworm | Antibiotics | Biotin Deficiency | Moderate | 46 | Yes | Yes | No | No | 0 |
| 4 | 111915 | No | No | Psoriasis | Accutane | Iron deficiency | Moderate | 30 | No | Yes | Yes | No | 1 |
实际应用与挑战
个性化干预建议生成:基于预测结果的营养补充或药物推荐
数据隐私与伦理问题:基因组数据的敏感性
模型可解释性:SHAP(Shapley Additive Explanations)方法的应用
局限性:样本偏差、长期动态预测的难度
# 缺失值处理
df.replace("No Data",pd.NA,inplace=True)
df.head()
| ID | 遗传因素 | 荷尔蒙变化 | 医疗状况 | 药物及治疗 | 营养缺乏 | 压力水平 | 年龄 | 不良护发习惯 | 环境因素 | 吸烟习惯 | 体重减轻 | 脱发标记 | |
|---|---|---|---|---|---|---|---|---|---|---|---|---|---|
| 0 | 133992 | Yes | No | <NA> | <NA> | Magnesium deficiency | Moderate | 19 | Yes | Yes | No | No | 0 |
| 1 | 148393 | No | No | Eczema | Antibiotics | Magnesium deficiency | High | 43 | Yes | Yes | No | No | 0 |
| 2 | 155074 | No | No | Dermatosis | Antifungal Cream | Protein deficiency | Moderate | 26 | Yes | Yes | No | Yes | 0 |
| 3 | 118261 | Yes | Yes | Ringworm | Antibiotics | Biotin Deficiency | Moderate | 46 | Yes | Yes | No | No | 0 |
| 4 | 111915 | No | No | Psoriasis | Accutane | Iron deficiency | Moderate | 30 | No | Yes | Yes | No | 1 |
未来研究方向
多模态数据融合:结合穿戴设备(如睡眠监测)的实时数据
迁移学习:利用其他医学领域数据提升小样本场景下的性能
自动化诊断工具:与智能医疗硬件(如AI头皮检测仪)结合
#二值列转换
binary_cols= ['遗传因素', '荷尔蒙变化', '不良护发习惯', '环境因素', '吸烟习惯', '体重减轻']
for col in binary_cols:
    df[col]=df[col].map({'Yes':1,'No':0, pd.NA:np.nan})

df.head()
| ID | 遗传因素 | 荷尔蒙变化 | 医疗状况 | 药物及治疗 | 营养缺乏 | 压力水平 | 年龄 | 不良护发习惯 | 环境因素 | 吸烟习惯 | 体重减轻 | 脱发标记 | |
|---|---|---|---|---|---|---|---|---|---|---|---|---|---|
| 0 | 133992 | 1.0 | 0.0 | <NA> | <NA> | Magnesium deficiency | Moderate | 19 | 1.0 | 1.0 | 0.0 | 0.0 | 0 |
| 1 | 148393 | 0.0 | 0.0 | Eczema | Antibiotics | Magnesium deficiency | High | 43 | 1.0 | 1.0 | 0.0 | 0.0 | 0 |
| 2 | 155074 | 0.0 | 0.0 | Dermatosis | Antifungal Cream | Protein deficiency | Moderate | 26 | 1.0 | 1.0 | 0.0 | 1.0 | 0 |
| 3 | 118261 | 1.0 | 1.0 | Ringworm | Antibiotics | Biotin Deficiency | Moderate | 46 | 1.0 | 1.0 | 0.0 | 0.0 | 0 |
| 4 | 111915 | 0.0 | 0.0 | Psoriasis | Accutane | Iron deficiency | Moderate | 30 | 0.0 | 1.0 | 1.0 | 0.0 | 1 |
# 创建高压力分组
df['高压力']=df['压力水平'].apply(lambda x:1 if x=='High' else 0)
df.head()
| ID | 遗传因素 | 荷尔蒙变化 | 医疗状况 | 药物及治疗 | 营养缺乏 | 压力水平 | 年龄 | 不良护发习惯 | 环境因素 | 吸烟习惯 | 体重减轻 | 脱发标记 | 高压力 | |
|---|---|---|---|---|---|---|---|---|---|---|---|---|---|---|
| 0 | 133992 | 1.0 | 0.0 | <NA> | <NA> | Magnesium deficiency | Moderate | 19 | 1.0 | 1.0 | 0.0 | 0.0 | 0 | 0 |
| 1 | 148393 | 0.0 | 0.0 | Eczema | Antibiotics | Magnesium deficiency | High | 43 | 1.0 | 1.0 | 0.0 | 0.0 | 0 | 1 |
| 2 | 155074 | 0.0 | 0.0 | Dermatosis | Antifungal Cream | Protein deficiency | Moderate | 26 | 1.0 | 1.0 | 0.0 | 1.0 | 0 | 0 |
| 3 | 118261 | 1.0 | 1.0 | Ringworm | Antibiotics | Biotin Deficiency | Moderate | 46 | 1.0 | 1.0 | 0.0 | 0.0 | 0 | 0 |
| 4 | 111915 | 0.0 | 0.0 | Psoriasis | Accutane | Iron deficiency | Moderate | 30 | 0.0 | 1.0 | 1.0 | 0.0 | 1 | 0 |
#脱发标记分布
data=df['脱发标记'].value_counts()

plt.figure(figsize=(8,5))
plt.pie(data,labels=['不脱发','脱发'],autopct='%.2f%%',startangle=90,shadow=True)
plt.title('脱发标记分布')
plt.show()
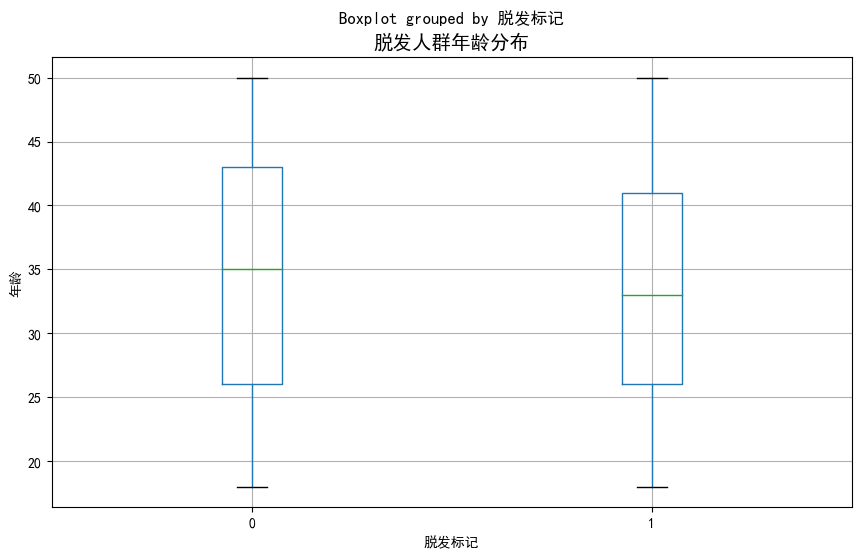
# 年龄与脱发关系
fig=plt.figure(figsize=(10,6))
ax1=plt.subplot(111)
df.boxplot(column='年龄',by='脱发标记',ax=ax1,)
ax1.set_title('脱发人群年龄分布',fontsize=14)
ax1.set_ylabel('年龄')
plt.show()
#常见医疗诊断分析
plt.figure(figsize=(12, 8))
top_conditions = df['医疗状况'].value_counts().head(10)
plt.barh(top_conditions.index,top_conditions) #横向柱状图
plt.title('十大常见脱发相关医疗状况', fontsize=14)
plt.xlabel('样本数量', fontsize=12)
plt.ylabel('医疗状况', fontsize=12)
plt.tight_layout()
plt.show()
plt.figure(figsize=(12,8))

top8_nutrition=df['营养缺乏'].value_counts().head(8)

plt.barh(top8_nutrition.index,top8_nutrition)
plt.title('常见脱发相关营养缺乏类型', fontsize=16, pad=20)
plt.xlabel('样本数量', fontsize=14)
plt.ylabel('营养缺乏类型', fontsize=14)
plt.xticks(fontsize=12)
plt.yticks(fontsize=12)

plt.show()
# 二值特征与脱发关系
features = ['遗传因素', '荷尔蒙变化', '不良护发习惯', '环境因素', '吸烟习惯', '体重减轻']

fig,axes=plt.subplots(3,2,figsize=(15,15))
axes=axes.flatten()
df['脱发标记'] = df['脱发标记'].astype('category')
categories = df['脱发标记'].cat.categories
num_categories = len(categories)
x=np.arange(num_categories)
width=0.35

for i ,feature in enumerate(features):#枚举每个特征
    if i < len(axes):
        ax=axes[i]
        #计算每个类别中1和0的数量
        counts=df.groupby('脱发标记')[feature].value_counts().unstack(fill_value=0)
        rects1=ax.bar(x-width/2,counts[0],width)
        rects1=ax.bar(x+width/2,counts[1],width)
        ax.set_title(f'{feature}与脱发')
        #ax.set_ylable('数量')
        ax.set_xticks(x)
        ax.set_xticklabels(categories)
        ax.legend(['无','有'])

plt.tight_layout()
plt.show()

counts
| 体重减轻 | 0.0 | 1.0 |
|---|---|---|
| 脱发标记 | ||
| 0 | 276 | 226 |
| 1 | 251 | 246 |
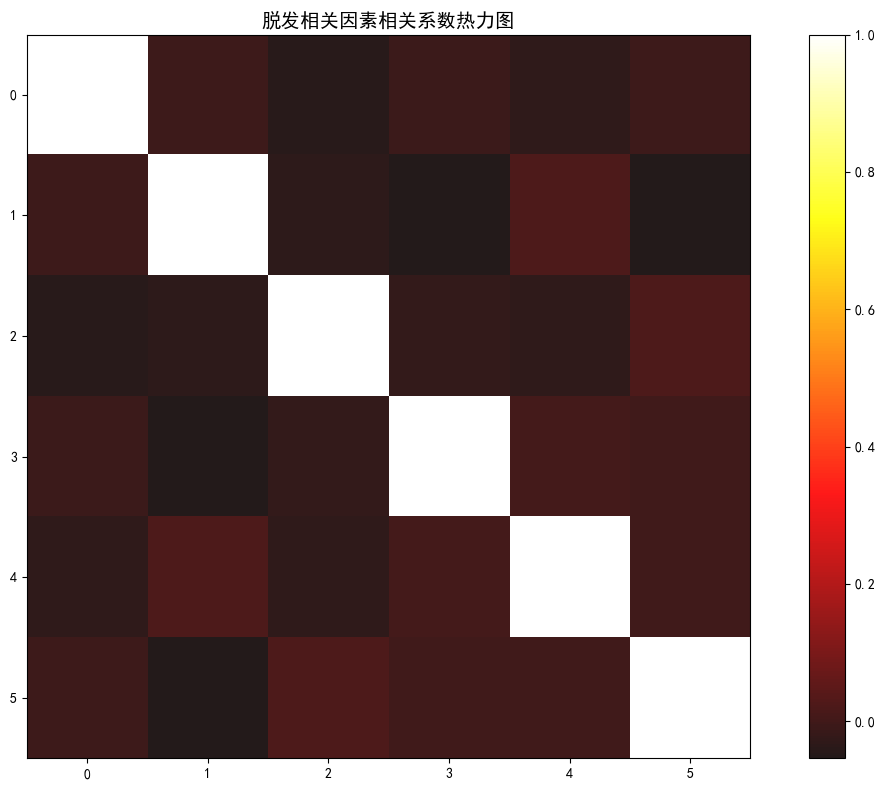
# 特征相关性分析
corr_features = ['遗传因素', '荷尔蒙变化', '高压力', '不良护发习惯', '吸烟习惯', '体重减轻', '脱发标记']
corr = df[corr_features].corr()
plt.figure(figsize=(12, 8))
plt.imshow(corr, cmap='hot',interpolation='nearest',alpha=0.9)
plt.colorbar()
plt.title('脱发相关因素相关系数热力图', fontsize=14)

plt.tight_layout()
plt.show()

df.head()
| ID | 遗传因素 | 荷尔蒙变化 | 医疗状况 | 药物及治疗 | 营养缺乏 | 压力水平 | 年龄 | 不良护发习惯 | 环境因素 | 吸烟习惯 | 体重减轻 | 脱发标记 | 高压力 | |
|---|---|---|---|---|---|---|---|---|---|---|---|---|---|---|
| 0 | 133992 | 1.0 | 0.0 | <NA> | <NA> | Magnesium deficiency | Moderate | 19 | 1.0 | 1.0 | 0.0 | 0.0 | 0 | 0 |
| 1 | 148393 | 0.0 | 0.0 | Eczema | Antibiotics | Magnesium deficiency | High | 43 | 1.0 | 1.0 | 0.0 | 0.0 | 0 | 1 |
| 2 | 155074 | 0.0 | 0.0 | Dermatosis | Antifungal Cream | Protein deficiency | Moderate | 26 | 1.0 | 1.0 | 0.0 | 1.0 | 0 | 0 |
| 3 | 118261 | 1.0 | 1.0 | Ringworm | Antibiotics | Biotin Deficiency | Moderate | 46 | 1.0 | 1.0 | 0.0 | 0.0 | 0 | 0 |
| 4 | 111915 | 0.0 | 0.0 | Psoriasis | Accutane | Iron deficiency | Moderate | 30 | 0.0 | 1.0 | 1.0 | 0.0 | 1 | 0 |
结语
技术驱动的脱发预测对早期干预的意义
跨学科合作(医学、数据科学、生物工程)的必要性
# 缺失值处理(删除少量缺失行)
df.dropna(subset=['脱发标记', '医疗状况', '药物及治疗', '营养缺乏'], inplace=True)
# 复合变量
# 遗传因素+高压力组合
df['遗传高压力组合'] = ((df['遗传因素'] == 1) & (df['高压力'] == 1)).astype(int)
# 标签编码分类变量
label_encoders = {}
categorical_cols = ['医疗状况', '药物及治疗', '营养缺乏', '压力水平']
for col in categorical_cols:
    le = LabelEncoder()
    df[col] = le.fit_transform(df[col].astype(str))
    label_encoders[col] = le
df
| ID | 遗传因素 | 荷尔蒙变化 | 医疗状况 | 药物及治疗 | 营养缺乏 | 压力水平 | 年龄 | 不良护发习惯 | 环境因素 | 吸烟习惯 | 体重减轻 | 脱发标记 | 高压力 | 遗传高压力组合 | |
|---|---|---|---|---|---|---|---|---|---|---|---|---|---|---|---|
| 1 | 148393 | 0.0 | 0.0 | 4 | 1 | 2 | 0 | 43 | 1.0 | 1.0 | 0.0 | 0.0 | 0 | 1 | 0 |
| 2 | 155074 | 0.0 | 0.0 | 3 | 3 | 4 | 2 | 26 | 1.0 | 1.0 | 0.0 | 1.0 | 0 | 0 | 0 |
| 3 | 118261 | 1.0 | 1.0 | 6 | 1 | 0 | 2 | 46 | 1.0 | 1.0 | 0.0 | 0.0 | 0 | 0 | 0 |
| 4 | 111915 | 0.0 | 0.0 | 5 | 0 | 1 | 2 | 30 | 0.0 | 1.0 | 1.0 | 0.0 | 1 | 0 | 0 |
| 5 | 139661 | 1.0 | 0.0 | 5 | 1 | 2 | 1 | 37 | 0.0 | 1.0 | 0.0 | 1.0 | 1 | 0 | 0 |
| ... | ... | ... | ... | ... | ... | ... | ... | ... | ... | ... | ... | ... | ... | ... | ... |
| 992 | 181854 | 1.0 | 1.0 | 3 | 8 | 2 | 1 | 30 | 0.0 | 0.0 | 0.0 | 0.0 | 1 | 0 | 0 |
| 994 | 184367 | 1.0 | 0.0 | 8 | 8 | 6 | 1 | 33 | 1.0 | 1.0 | 1.0 | 1.0 | 1 | 0 | 0 |
| 996 | 143273 | 0.0 | 1.0 | 1 | 2 | 4 | 2 | 20 | 1.0 | 0.0 | 1.0 | 1.0 | 1 | 0 | 0 |
| 997 | 169123 | 0.0 | 1.0 | 2 | 7 | 0 | 2 | 32 | 1.0 | 1.0 | 1.0 | 1.0 | 1 | 0 | 0 |
| 998 | 127183 | 1.0 | 1.0 | 5 | 4 | 7 | 1 | 34 | 0.0 | 1.0 | 0.0 | 0.0 | 1 | 0 | 0 |
809 rows × 15 columns
# 特征选择(部分可能部分重复,但影响不大)
features = [
    '遗传因素', '荷尔蒙变化', '医疗状况', '药物及治疗',
    '营养缺乏', '压力水平', '年龄', '不良护发习惯',
    '环境因素', '吸烟习惯', '体重减轻', '高压力',
    '遗传高压力组合'
]

X = df[features]
y = df['脱发标记']
# 划分训练集和测试集
X_train, X_test, y_train, y_test = train_test_split(
    X, y, test_size=0.15, random_state=42, stratify=y
)
def evaluate_model(model, model_name, X_train, X_test, y_train, y_test): #模型对象、模型名称,x训练集,y训练集,x测试集
# 训练模型
model.fit(X_train, y_train)
# 预测
y_pred = model.predict(X_test)
# 打印分类报告
print(f"=== {model_name} 模型评估 ===")
print(classification_report(y_test, y_pred))#包含准确率、召回率、f1测度、支持率
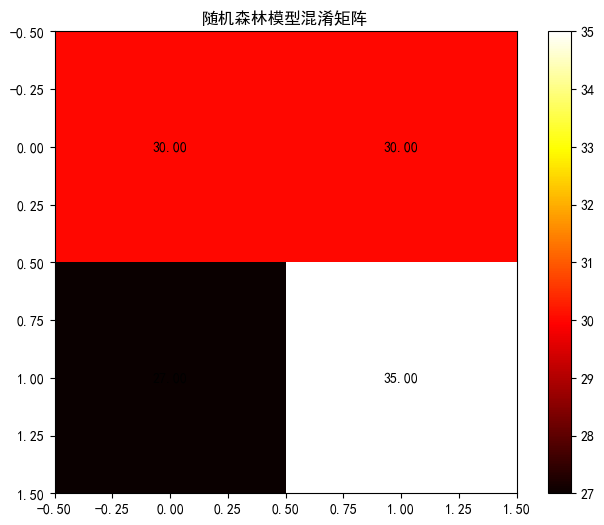
# 绘制混淆矩阵
cm = confusion_matrix(y_test, y_pred) #返回混淆矩阵
plt.figure(figsize=(8, 6))
plt.imshow(cm,cmap='hot',interpolation='nearest')#热力图
plt.colorbar()#视觉映射
#添加标签
for i in range(2):
for j in range(2):
plt.text(j, i, f'{cm[i, j]:.2f}', ha='center', va='center', color='black')
plt.title(f'{model_name}模型混淆矩阵')
plt.show()
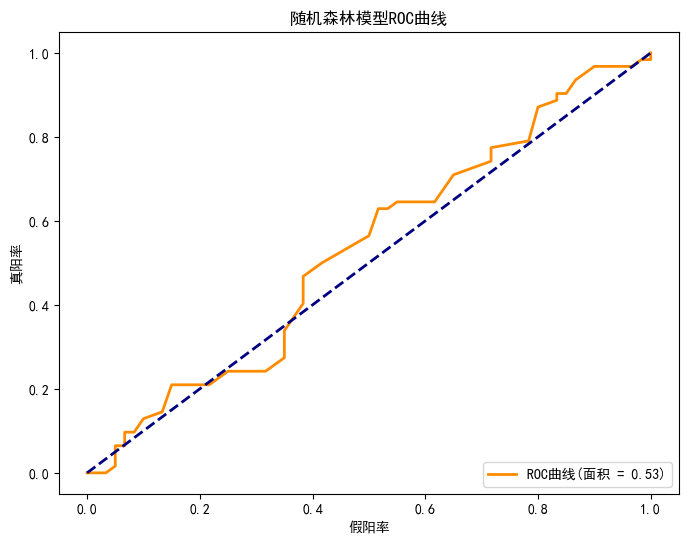
# 绘制ROC曲线
if hasattr(model, "predict_proba"):#hasattr用于检查对象是否具有指定的属性
y_prob = model.predict_proba(X_test)[:, 1]
else: # 对于SVM等没有predict_proba方法的模型
y_prob = model.decision_function(X_test) if hasattr(model, "decision_function") else y_pred
fpr, tpr, _ = roc_curve(y_test, y_prob) #roc曲线
roc_auc = auc(fpr, tpr) #auc面积
plt.figure(figsize=(8, 6))
plt.plot(fpr, tpr, color='darkorange', lw=2, label='ROC曲线(面积 = %0.2f)' % roc_auc)
plt.plot([0, 1], [0, 1], color='navy', lw=2, linestyle='--')
plt.xlabel('假阳率')
plt.ylabel('真阳率')
plt.title(f'{model_name}模型ROC曲线')
plt.legend(loc="lower right")
plt.show()
return model, roc_auc
rf_model = RandomForestClassifier(random_state=15, class_weight='balanced')
rf_model, rf_auc = evaluate_model(rf_model, "随机森林", X_train, X_test, y_train, y_test)
=== 随机森林 模型评估 ===
precision recall f1-score support
0 0.53 0.50 0.51 60
1 0.54 0.56 0.55 62
accuracy 0.53 122
macro avg 0.53 0.53 0.53 122
weighted avg 0.53 0.53 0.53 122

---------------------------------------------------------------------------

NameError                                 Traceback (most recent call last)

Cell In[29], line 1
----> 1 xgb_model = xgb.XGBClassifier(random_state=15, scale_pos_weight=sum(y_train==0)/sum(y_train==1))
      2 xgb_model, xgb_auc = evaluate_model(xgb_model, "XGBoost", X_train, X_test, y_train, y_test)


NameError: name 'xgb' is not defined


 1622
1622

 被折叠的 条评论
为什么被折叠?
被折叠的 条评论
为什么被折叠?
 到【灌水乐园】发言


