


概述
psutil(python system and process utilities)是一个跨平台的第三方库,用于获取系统运行时的进程和系统利用率(包括CPU、内存、磁盘、网络等)信息。主要用于系统监控,性能分析,进程管理等。
结果预览
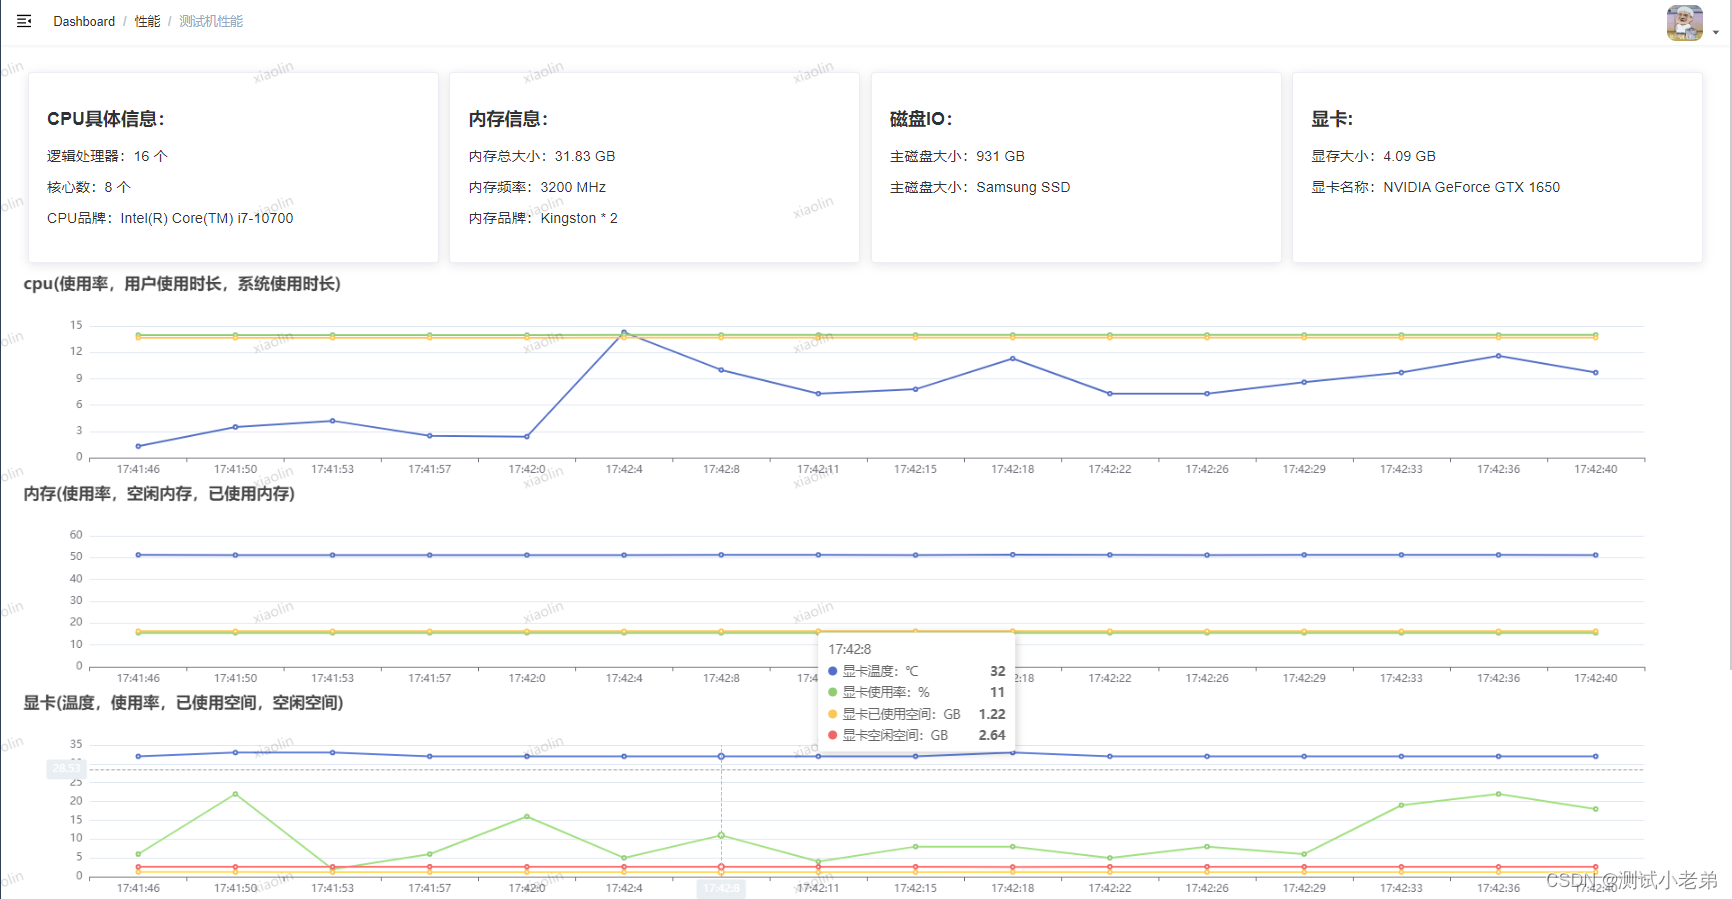
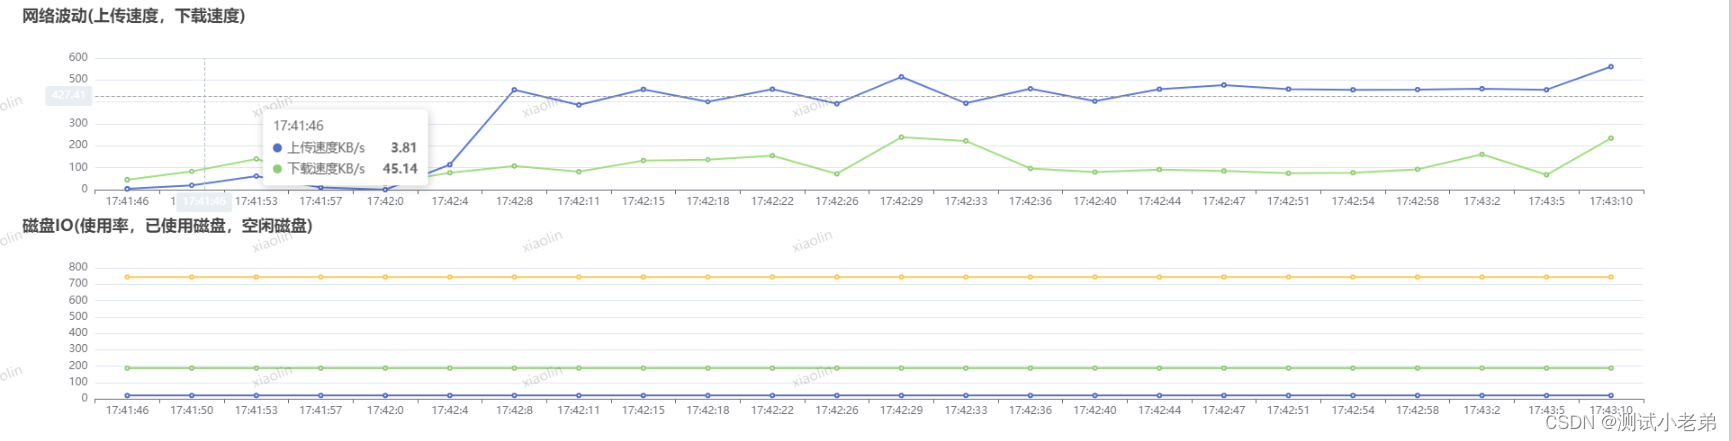
监控指标
CPU ,内存,网络,磁盘,显卡
前端实现
<template>
  <div style="padding: 20px">
    <div style="padding: 10px">
      <el-row :gutter="12">
        <el-col :span="6">
          <el-card shadow="always" body-style="{ padding: '10px' }">
            <div style="height: 150px">
              <p style="font-weight: bold; font-size: 20px">CPU具体信息:</p>
              <p>逻辑处理器:{{ num_logical_cores }} 个</p>
              <p>核心数:{{ num_cores }} 个</p>
              <p>CPU品牌:{{ cpu_name }}</p>
            </div>
          </el-card>
        </el-col>
        <el-col :span="6">
          <el-card shadow="always">
            <div style="height: 150px">
              <p style="font-weight: bold; font-size: 20px">内存信息:</p>
              <p>内存总大小:{{ memory_total }} GB</p>
              <p>内存频率:{{ memory_MHz }} MHz</p>
              <p>内存品牌:{{ memory_brand }}</p>
            </div>
          </el-card>
        </el-col>
        <el-col :span="6">
          <el-card shadow="always">
            <div style="height: 150px">
              <p style="font-weight: bold; font-size: 20px">磁盘IO:</p>
              <p>主磁盘大小:{{ disk_total }} GB</p>
              <p>主磁盘大小:{{ disk_brand }}</p>
            </div>
          </el-card>
        </el-col>
        <el-col :span="6">
          <el-card shadow="always">
            <div style="height: 150px">
              <p style="font-weight: bold; font-size: 20px">显卡:</p>
              <p>显存大小:{{ gpu_memoryTotal }} GB</p>
              <p>显卡名称:{{ gpu_name }}</p>
            </div>
          </el-card>
        </el-col>
      </el-row>
    </div>
    <div>
      <div style="height: 233px">
        <div ref="chartContainer1" style="height: 233px" />
      </div>
      <div style="height: 233px">
        <div ref="chartContainer2" style="height: 233px" />
      </div>
      <div style="height: 233px">
        <div ref="chartContainer5" style="height: 233px" />
      </div>
      <div style="height: 233px">
        <div ref="chartContainer3" style="height: 233px" />
      </div>
      <div style="height: 233px">
        <div ref="chartContainer4" style="height: 233px" />
      </div>
    </div>
  </div>
</template>

<script>
import { get_com_performance } from "@/api/user";

export default {
  name: "ComputerView",
  data() {
    return {
      // cpu
      cpu_name: "Intel(R) Core(TM) i7-10700",
      num_cores: 8,
      num_logical_cores: 16,
      cpu_use_percent: [],
      cpu_times_user: [],
      cpu_times_system: [],
      cpu_freq: {},
      // 内存
      memory_used: [],
      memory_available: [],
      memory_use_percent: [],
      memory_total: 31.83,
      memory_MHz: 3200,
      memory_brand: "Kingston * 2",

      // 网络
      kbps_recv: [],
      kbps_sent: [],
      // 磁盘IO
      disk_percent: [],
      disk_total: 931.0,
      disk_used: [],
      disk_free: [],
      disk_brand: "Samsung SSD",

      // 显卡
      gpu_memoryUsed: [],
      gpu_temperature: [],
      gpu_percent: [],
      gpu_memoryTotal: 4.09,
      gpu_memoryFree: [],
      gpu_name: "NVIDIA GeForce GTX 1650",

      time: [],
      user_id: null,
      timer: null,
    }
  },
  created() {
    this.user_id = Number(localStorage.getItem("user_id"))
    this.get_computer_perf()
  },
  destroyed() {
    clearTimeout(this.timer)
  },
  methods: {
    get_computer_perf() {
      get_com_performance({ "user_id": this.user_id }).then(res => {
        if (res.data.code === 200) {
          this.cpu_use_percent.push(res.data.cpu.cpu_use_percent)
          this.cpu_times_user.push(res.data.cpu.cpu_times_user)
          this.cpu_times_system.push(res.data.cpu.cpu_times_system)

          this.memory_used.push(res.data.memory.memory_used)
          this.memory_available.push(res.data.memory.memory_available)
          this.memory_use_percent.push(res.data.memory.memory_use_percent)

          this.kbps_recv.push(res.data.network.kbps_recv)
          this.kbps_sent.push(res.data.network.kbps_sent)

          this.disk_percent.push(res.data.io.disk_percent)
          this.disk_used.push(res.data.io.disk_used)
          this.disk_free.push(res.data.io.disk_free)

          this.gpu_memoryUsed.push(res.data.gpu.gpu_memoryUsed)
          this.gpu_temperature.push(res.data.gpu.gpu_temperature)
          this.gpu_percent.push(res.data.gpu.gpu_percent)
          this.gpu_memoryFree.push(res.data.gpu.gpu_memoryFree)

          this.time.push(res.data.time)
          this.show_echarts_computer(
            this.cpu_use_percent, this.cpu_times_user, this.cpu_times_system,
            this.memory_used, this.memory_available, this.memory_use_percent,
            this.kbps_recv, this.kbps_sent,
            this.disk_percent, this.disk_used, this.disk_free,
            this.gpu_memoryUsed, this.gpu_temperature, this.gpu_percent, this.gpu_memoryFree,
            this.time
          )
        }
      }).finally(() => {
        this.timer = setTimeout(() => {
          this.get_computer_perf()
        }, 2000);
      })
    },
    show_echarts_computer(
      cpu_use_percent, cpu_times_user, cpu_times_system,
      memory_used, memory_available, memory_use_percent,
      kbps_recv, kbps_sent,
      disk_percent, disk_used, disk_free,
      gpu_memoryUsed, gpu_temperature, gpu_percent, gpu_memoryFree,
      time) {
      const myChart1 = this.$echarts.init(this.$refs.chartContainer1)
      const myChart2 = this.$echarts.init(this.$refs.chartContainer2)
      const myChart3 = this.$echarts.init(this.$refs.chartContainer3)
      const myChart4 = this.$echarts.init(this.$refs.chartContainer4)
      const myChart5 = this.$echarts.init(this.$refs.chartContainer5)
      const options1 = {
        title: {
          text: "cpu(使用率,用户使用时长,系统使用时长)"
        },
        tooltip: {
          trigger: "axis",
          axisPointer: {
            type: "cross",
            label: {
              backgroundColor: "#E9EEF3"
            }
          }
        },
        grid: {
          left: "3%",
          right: "4%",
          bottom: "3%",
          containLabel: true
        },
        xAxis: {
          type: 'category',
          data: time,
        },
        yAxis: {
          type: 'value',
        },
        series: [
          {
            name: "CPU使用率%",
            data: cpu_use_percent,
            type: 'line',
          },
          {
            name: "用户使用时长:小时",
            data: cpu_times_user,
            type: 'line',
          },
          {
            name: "系统使用时长:小时",
            data: cpu_times_system,
            type: 'line',
          },
        ],
      }
      myChart1.setOption(options1)
      // 自适应容器大小
      window.addEventListener('resize', function() {
        myChart1.resize();
      })
      const options2 = {
        title: {
          text: "内存(使用率,空闲内存,已使用内存)"
        },
        tooltip: {
          trigger: "axis",
          axisPointer: {
            type: "cross",
            label: {
              backgroundColor: "#E9EEF3"
            }
          }
        },
        grid: {
          left: "3%",
          right: "4%",
          bottom: "3%",
          containLabel: true
        },
        xAxis: {
          type: 'category',
          data: time,
        },
        yAxis: {
          type: 'value',
        },
        series: [
          {
            name: "内存使用率%",
            data: memory_use_percent,
            type: 'line',
          },
          {
            name: "空闲内存:GB",
            data: memory_available,
            type: 'line',
          },
          {
            name: "已使用内存:GB",
            data: memory_used,
            type: 'line',
          },
        ],
      }
      myChart2.setOption(options2)
      window.addEventListener('resize', function() {
        myChart2.resize();
      })
      const options3 = {
        title: {
          text: "网络波动(上传速度,下载速度)"
        },
        tooltip: {
          trigger: "axis",
          axisPointer: {
            type: "cross",
            label: {
              backgroundColor: "#E9EEF3"
            }
          }
        },
        grid: {
          left: "3%",
          right: "4%",
          bottom: "3%",
          containLabel: true
        },
        xAxis: {
          type: 'category',
          data: time,
        },
        yAxis: {
          type: 'value',
        },
        series: [
          {
            name: "上传速度KB/s",
            data: kbps_sent,
            type: 'line',
          },
          {
            name: "下载速度KB/s",
            data: kbps_recv,
            type: 'line',
          },
        ],
      }
      myChart3.setOption(options3)
      window.addEventListener('resize', function() {
        myChart3.resize();
      })
      const options4 = {
        title: {
          text: "磁盘IO(使用率,已使用磁盘,空闲磁盘)"
        },
        tooltip: {
          trigger: "axis",
          axisPointer: {
            type: "cross",
            label: {
              backgroundColor: "#E9EEF3"
            }
          }
        },
        grid: {
          left: "3%",
          right: "4%",
          bottom: "3%",
          containLabel: true
        },
        xAxis: {
          type: 'category',
          data: time,
        },
        yAxis: {
          type: 'value',
        },
        series: [
          {
            name: "磁盘使用率%",
            data: disk_percent,
            type: 'line',
          },
          {
            name: "已使用磁盘空间:GB",
            data: disk_used,
            type: 'line',
          },
          {
            name: "空闲磁盘空间:GB",
            data: disk_free,
            type: 'line',
          }
        ],
      }
      myChart4.setOption(options4)
      window.addEventListener('resize', function() {
        myChart4.resize();
      })
      const options5 = {
        title: {
          text: "显卡(温度,使用率,已使用空间,空闲空间)",
        },
        tooltip: {
          trigger: "axis",
          axisPointer: {
            type: "cross",
            label: {
              backgroundColor: "#E9EEF3"
            }
          }
        },
        grid: {
          left: "3%",
          right: "4%",
          bottom: "3%",
          containLabel: true
        },
        xAxis: {
          type: 'category',
          data: time,
        },
        yAxis: {
          type: 'value',
        },
        series: [
          {
            name: "显卡温度:℃",
            data: gpu_temperature,
            type: 'line',
          },
          {
            name: "显卡使用率:%",
            data: gpu_percent,
            type: 'line',
          },
          {
            name: "显卡已使用空间:GB",
            data: gpu_memoryUsed,
            type: 'line',
          },
          {
            name: "显卡空闲空间:GB",
            data: gpu_memoryFree,
            type: 'line',
          },
        ],
      }
      myChart5.setOption(options5)
      window.addEventListener('resize', function() {
        myChart5.resize();
      })
    },
  }
}
</script>

<style scoped>

</style>
服务端实现
# -*-coding:gbk-*-
from datetime import datetime
import wmi
import psutil
import time
import GPUtil
from django.http import JsonResponse


def get_com_performance(request):
    return JsonResponse({
        "code": 200,
        "message": "获取测试服务器性能成功",
        "cpu": get_com_cpu(),
        "memory": get_com_memory(),
        "network": get_com_network(),
        "io": get_com_io(),
        "gpu": get_com_gpu(),
        "time": get_now()
    })


def get_now():
    now = datetime.now()
    hours = now.hour
    minute = now.minute
    second = now.second
    return str(hours) + ":" + str(minute) + ":" + str(second)


def get_com_cpu():

    # 获取CPU使用时间
    cpu_times = psutil.cpu_times()

    # 获取CPU使用率
    cpu_percent = psutil.cpu_percent(interval=1)

    result_dict = {
        "cpu_use_percent": cpu_percent,
        "cpu_times_user": round(cpu_times.user / 60 / 60, 2),
        "cpu_times_system": round(cpu_times.system / 60 / 60, 2),

    }

    return result_dict


def get_com_memory():
    # 获取内存使用情况
    memory = psutil.virtual_memory()

    result_dict = {
        "memory_use_percent": memory.percent,
        "memory_used": round(memory.used / 1024 / 1024 / 1024, 2),
        "memory_available": round(memory.available / 1024 / 1024 / 1024, 2),
    }
    return result_dict


def get_com_io():
    # 获取磁盘使用情况
    disk = psutil.disk_usage('/')
    result_dict = {
        "disk_percent": disk.percent,
        "disk_used": round(disk.used / 1024 / 1024 / 1024, 2),
        "disk_free": round(disk.free / 1024 / 1024 / 1024, 2)
    }
    return result_dict


def get_com_gpu():
    gpus = GPUtil.getGPUs()
    for gpu in gpus:
        result_dict = {
            "gpu_memoryUsed": round(gpu.memoryUsed / 1024, 2),
            "gpu_temperature": gpu.temperature,
            "gpu_percent": round(gpu.load * 100, 2),
            "gpu_memoryFree": round(gpu.memoryFree / 1024, 2)
        }
        return result_dict


def get_com_network():
    time_interval = 0.5  # 请将此值替换为实际的时间间隔(以秒为单位)

    net_io_counters_before = psutil.net_io_counters()
    time.sleep(time_interval)
    net_io_counters_after = psutil.net_io_counters()

    bytes_sent_per_second = (net_io_counters_after.bytes_sent - net_io_counters_before.bytes_sent) / time_interval
    bytes_recv_per_second = (net_io_counters_after.bytes_recv - net_io_counters_before.bytes_recv) / time_interval

    kbps_sent = bytes_sent_per_second * 8 / 1024
    kbps_recv = bytes_recv_per_second * 8 / 1024
    result_dict = {
        "kbps_sent": round(kbps_sent, 2),
        "kbps_recv": round(kbps_recv, 2),
    }
    return result_dict


 1万+
1万+

 被折叠的 条评论
为什么被折叠?
被折叠的 条评论
为什么被折叠?
 到【灌水乐园】发言


