


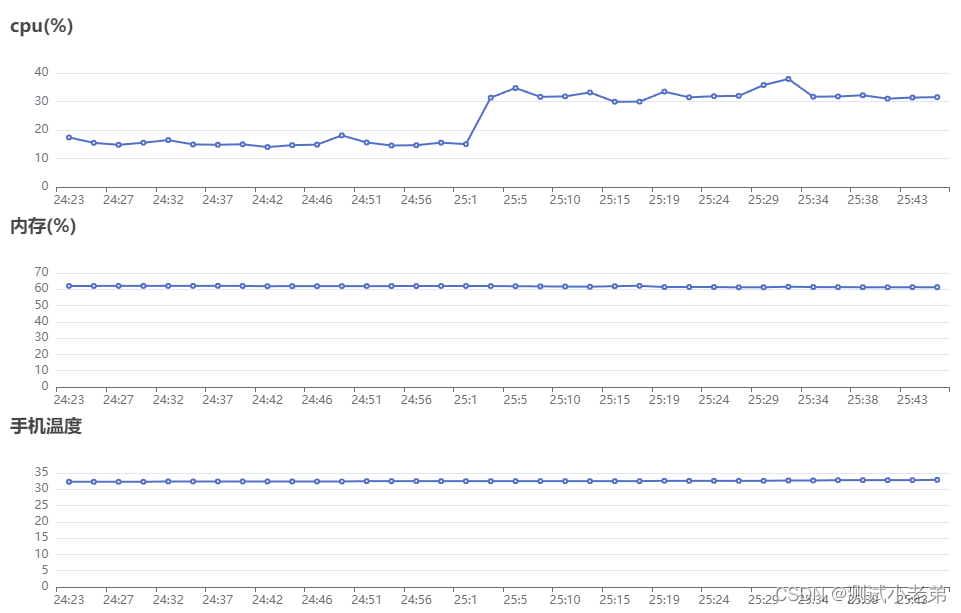
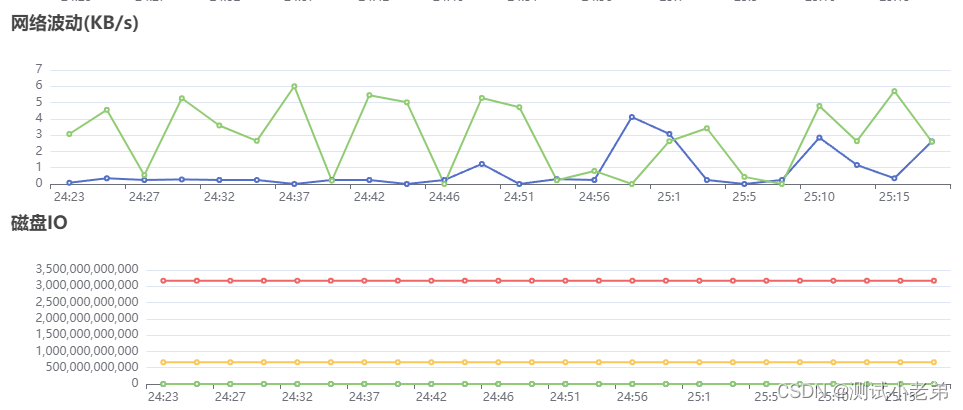
结果展示
实现逻辑-后端
获取性能指标:
# 内存
def get_memory(device_id):
    cmd = 'adb -s {} shell cat /proc/meminfo'.format(device_id)
    result = os.popen(cmd).read().split()
    memory = (int(result[1]) - int(result[7])) / int(result[1]) * 100
    return round(memory, 2)


# CPU
def get_cpu_info(device_id):
    cmd = 'adb -s {} shell cat /proc/stat'.format(device_id)
    result = os.popen(cmd).read().split()
    return result


# CPU
def get_cpu(device_id):
    # 获取第一个时间点的CPU信息
    stat1 = get_cpu_info(device_id)

    # 等待一段时间
    time.sleep(1)

    # 获取第二个时间点的CPU信息
    stat2 = get_cpu_info(device_id)

    # 计算总的CPU时间
    total1 = sum([int(stat1[i]) for i in range(1, 8)])
    total2 = sum([int(stat2[i]) for i in range(1, 8)])

    # 计算空闲的CPU时间
    idle1 = int(stat1[4])
    idle2 = int(stat2[4])

    total = total2 - total1
    idle = idle2 - idle1

    # 计算CPU使用率
    cpu_usage = (total - idle) / total * 100

    return round(cpu_usage, 2)


# 实时网速
def get_network(device):
    try:
        cmd = f'adb -s {device} shell cat /proc/net/dev'
        output1 = subprocess.check_output(cmd, shell=True, universal_newlines=True)
        time.sleep(0.5)  # 等待1秒
        output2 = subprocess.check_output(cmd, shell=True, universal_newlines=True)
        # 解析输出以获取上传和下载网速
        upload_speed1 = 0
        download_speed1 = 0
        upload_speed2 = 0
        download_speed2 = 0

        for line in output1.splitlines():
            if "wlan0" in line:  # 根据实际情况选择正确的网卡名称
                parts = re.findall(r'\d+', line)
                upload_speed1 = int(parts[9])  # 第9个为上传速度
                download_speed1 = int(parts[1])  # 第1个数字为下载速度
                break

        for line in output2.splitlines():
            if "wlan0" in line:  # 根据实际情况选择正确的网卡名称
                parts = re.findall(r'\d+', line)
                upload_speed2 = int(parts[9])  # 第9个为上传速度
                download_speed2 = int(parts[1])  # 第1个数字为下载速度
                break

        # 计算网速并转换为KB/s
        upload_speed_kb = (upload_speed2 - upload_speed1) / 1024
        download_speed_kb = (download_speed2 - download_speed1) / 1024
        return download_speed_kb, upload_speed_kb
    except Exception as e:
        print(e)
        return 0, 0


# 磁盘(代替使用,具体待重写)
def get_disk():
    disk_io = psutil.disk_io_counters()
    return int(disk_io.read_count), int(disk_io.write_count), int(disk_io.read_bytes), int(disk_io.write_bytes)


# 手机温度
def get_temperature(devices):
    command = f"adb -s {devices} shell dumpsys battery"
    output = subprocess.check_output(command, shell=True).decode("utf-8")
    temperature_line = next(line for line in output.splitlines() if "temperature" in line)
    temperature_value = int(temperature_line.split(":")[1].strip()) / 10
    return temperature_value
整合性能数据:
def get_device_performance(request):
    data = json.loads(request.body)
    device_uuid = data["device_uuid"]
    disk_list = {
        "read_count": "",
        "write_count": "",
        "read_bytes": "",
        "write_bytes": ""
    }
    time = get_now()
    cpu = get_cpu(device_uuid)
    memory = get_memory(device_uuid)
    up_network = get_network(device_uuid)[1]
    down_network = get_network(device_uuid)[0]
    disk_list["read_count"] = get_disk()[0]
    disk_list["write_count"] = get_disk()[1]
    disk_list["read_bytes"] = get_disk()[2]
    disk_list["write_bytes"] = get_disk()[3]
    temperature = get_temperature(data["device_uuid"])
    return JsonResponse({
        "code": 200,
        "time": time,
        "cpu": cpu,
        "memory": memory,
        "up_network": up_network,
        "down_network": down_network,
        "disk": disk_list,
        "temperature": temperature

    })
前端实现
前端页面布局:
<el-tab-pane label="设备性能情况" name="six">
        <div style="height: 700px; overflow: auto">
                <div style="width: 100%; height: 200px">
                  <div ref="chart_1" style="width: 100%; height: 100%" />
                </div>
                <div style="width: 100%; height: 200px">
                  <div ref="chart_2" style="width: 100%; height: 100%" />
                </div>
                <div style="width: 100%; height: 200px">
                  <div ref="chart_5" style="width: 100%; height: 100%" />
                </div>
                <div style="width: 100%; height: 200px">
                  <div ref="chart_3" style="width: 100%; height: 100%" />
                </div>
                <div style="width: 100%; height: 200px">
                  <div ref="chart_4" style="width: 100%; height: 100%" />
                </div>
              </div>
            </el-tab-pane>
JS方法:
get_performance(data) {
      get_device_perf({ "device_uuid": data, "user_id": Number(localStorage.getItem("user_id")) }).then(res => {
        if (res.data.code === 200) {
          this.time.push(res.data.time)
          this.cpu.push(res.data.cpu)
          this.memory.push(res.data.memory)
          this.read_count.push(res.data.disk.read_count)
          this.write_count.push(res.data.disk.write_count)
          this.read_bytes.push(res.data.disk.read_bytes)
          this.write_bytes.push(res.data.disk.write_bytes)
          this.up_network.push(res.data.up_network)
          this.down_network.push(res.data.down_network)
          this.temperature.push(res.data.temperature)
          this.show_echarts(this.cpu, this.memory, this.up_network, this.down_network, this.time, this.temperature,
            this.read_count, this.write_count, this.read_bytes, this.write_bytes
          )
        }
      })
    },
    show_echarts(cpu, memory, up_network, down_network, time, temperature, read_count, write_count, read_bytes, write_bytes) {
      const myChart1 = this.$echarts.init(this.$refs.chart_1)
      const myChart2 = this.$echarts.init(this.$refs.chart_2)
      const myChart3 = this.$echarts.init(this.$refs.chart_3)
      const myChart4 = this.$echarts.init(this.$refs.chart_4)
      const myChart5 = this.$echarts.init(this.$refs.chart_5)
      const options1 = {
        title: {
          text: "cpu(%)"
        },
        tooltip: {
          trigger: "axis",
          axisPointer: {
            type: "cross",
            label: {
              backgroundColor: "#E9EEF3"
            }
          }
        },
        grid: {
          left: "3%",
          right: "4%",
          bottom: "3%",
          containLabel: true
        },
        xAxis: {
          type: 'category',
          data: time,
        },
        yAxis: {
          type: 'value',
        },
        series: [
          {
            name: "%",
            data: cpu,
            type: 'line',
          },
        ],
      }
      myChart1.setOption(options1)
      // 自适应容器大小
      window.addEventListener('resize', function() {
        myChart1.resize();
      })
      const options2 = {
        title: {
          text: "内存(%)"
        },
        tooltip: {
          trigger: "axis",
          axisPointer: {
            type: "cross",
            label: {
              backgroundColor: "#E9EEF3"
            }
          }
        },
        grid: {
          left: "3%",
          right: "4%",
          bottom: "3%",
          containLabel: true
        },
        xAxis: {
          type: 'category',
          data: time,
        },
        yAxis: {
          type: 'value',
        },
        series: [
          {
            name: "%",
            data: memory,
            type: 'line',
          },
        ],
      }
      myChart2.setOption(options2)
      window.addEventListener('resize', function() {
        myChart2.resize();
      })
      const options3 = {
        title: {
          text: "网络波动(KB/s)"
        },
        tooltip: {
          trigger: "axis",
          axisPointer: {
            type: "cross",
            label: {
              backgroundColor: "#E9EEF3"
            }
          }
        },
        grid: {
          left: "3%",
          right: "4%",
          bottom: "3%",
          containLabel: true
        },
        xAxis: {
          type: 'category',
          data: time,
        },
        yAxis: {
          type: 'value',
        },
        series: [
          {
            name: "上传速度KB/s",
            data: up_network,
            type: 'line',
          },
          {
            name: "下载速度KB/s",
            data: down_network,
            type: 'line',
          },
        ],
      }
      myChart3.setOption(options3)
      window.addEventListener('resize', function() {
        myChart3.resize();
      })
      const options4 = {
        title: {
          text: "磁盘IO"
        },
        tooltip: {
          trigger: "axis",
          axisPointer: {
            type: "cross",
            label: {
              backgroundColor: "#E9EEF3"
            }
          }
        },
        grid: {
          left: "3%",
          right: "4%",
          bottom: "3%",
          containLabel: true
        },
        xAxis: {
          type: 'category',
          data: time,
        },
        yAxis: {
          type: 'value',
        },
        series: [
          {
            name: "读取数量",
            data: read_count,
            type: 'line',
          },
          {
            name: "写入数量",
            data: write_count,
            type: 'line',
          },
          {
            name: "读取字节数",
            data: read_bytes,
            type: 'line',
          },
          {
            name: "写入字节数",
            data: write_bytes,
            type: 'line',
          }
        ],
      }
      myChart4.setOption(options4)
      window.addEventListener('resize', function() {
        myChart4.resize();
      })
      const options5 = {
        title: {
          text: "手机温度"
        },
        tooltip: {
          trigger: "axis",
          axisPointer: {
            type: "cross",
            label: {
              backgroundColor: "#E9EEF3"
            }
          }
        },
        grid: {
          left: "3%",
          right: "4%",
          bottom: "3%",
          containLabel: true
        },
        xAxis: {
          type: 'category',
          data: time,
        },
        yAxis: {
          type: 'value',
        },
        series: [
          {
            name: "℃",
            data: temperature,
            type: 'line',
          },
        ],
      }
      myChart5.setOption(options5)
      window.addEventListener('resize', function() {
        myChart5.resize();
      })
      this.startDataInterval()
    },
    startDataInterval() {
      // 首先立即执行一次
      if (this.timeout > 0) {
        this.timer = setInterval(this.get_performance(this.device_uuid), this.timeout);
      }
    },
总结:
主要为了更加直观的查看手机在运行过程中,手机硬件的性能使用情况,good luck!


 被折叠的 条评论
为什么被折叠?
被折叠的 条评论
为什么被折叠?
 到【灌水乐园】发言


