


Day 3
Information Theory Basis
-
Entropy
The entropy H ( x ) H(x) H(x) of a discrete random variable X X X with distribution p ( x ) p(x) p(x) is defined by H ( X ) = − ∑ x ∈ χ p ( x ) l o g p ( x ) H(X)=-\sum_{x\in \chi}p(x)logp(x) H(X)=−x∈χ∑p(x)logp(x) -
Joint Entropy
The joint entropy H ( X , Y ) H(X,Y) H(X,Y) of a pair of discrete random variables ( X , Y ) (X,Y) (X,Y) with a joint distribution p ( x , y ) p(x,y) p(x,y) is defined as H ( X , Y ) = − ∑ x ∈ X ∑ y ∈ Y p ( x , y ) l o g p ( x , y ) H(X,Y)=-\sum_{x\in \mathcal{X}}\sum_{y\in \mathcal{Y}}p(x,y)logp(x,y) H(X,Y)=−x∈X∑y∈Y∑p(x,y)logp(x,y) -
Conditional Entropy
The conditional entropy H ( Y ∣ X ) H(Y|X) H(Y∣X) of a pair of discrete random variables ( X , Y ) (X,Y) (X,Y) with a joint distribution p ( x , y ) p(x,y) p(x,y) is defined as H ( Y ∣ X ) = − ∑ x ∈ X ∑ y ∈ Y p ( x , y ) l o g p ( y ∣ x ) H(Y|X)=-\sum_{x\in \mathcal{X}}\sum_{y\in \mathcal{Y}}p(x,y)logp(y|x) H(Y∣X)=−x∈X∑y∈Y∑p(x,y)logp(y∣x) -
Information Gain
The information gain G ( X ) G(X) G(X) is defined as G ( X ) = H ( Y ) − H ( Y ∣ X ) G(X)=H(Y)-H(Y|X) G(X)=H(Y)−H(Y∣X) which represents the importance of condition X X X for the entropy H ( Y ) H(Y) H(Y). -
Gini impurity
The gini impurity a error rate to check whether a set of data belongs to the same category which is defined as I G ( f ) = ∑ i = 1 m f i ( 1 − f i ) I_G(f)=\sum_{i=1}^mf_i(1-f_i) IG(f)=i=1∑mfi(1−fi)
Smaller it is, more likely the set of data is the same category.
Decision Tree
Different classification algorithms
-
ID3 algorithm
For the same output class D i D_i Di, computes the information gain A g A_g Ag of every feature and find the maximum one. Then for each value in A g A_g Ag, find the different output classes D i D_i Di and repeat again if the maximum A g A_g Ag is more than the threshold ϵ \epsilon ϵ.
This algorithm is used for discrete features. -
C4.5 algorithm
It has the same principle as ID3, and overcomes the four disadvantages in ID3:- no consideration for continuous features
- different number of value in each feature can affect the result
- no consideration for the situation when there is a missing value in a feature
- no consideration for overfitting
solution for overfitting:
regularization for preliminary pruning
-
CART algorithm(classification and regression tree)
- the gini value would be the basis of node splitting for a classification tree
- the minimum variance of sample would be the basis of node splitting for a regression tree
Model evaluation
There are classifier and regression evaluation index for the classification and regression tree, respectively.
- auc and roc curve
- RMSE & quantiles of errors
note: more index referring previous article
The sklearn parameters
sklearn.tree.DecisionTreeClassifier(criterion='gini', splitter='best', max_depth=None, min_samples_split=2,min_samples_leaf=1, max_features=None, random_state=None, min_density=None, compute_importances=None,max_leaf_nodes=None)
- criterion: feature splitting method(‘gini’ or ‘entropy’)
- max_depth: the maximum depth of the decision tree, and overcome overfitting
- min_samples_leaf: the minimum number of sample included in leaf node
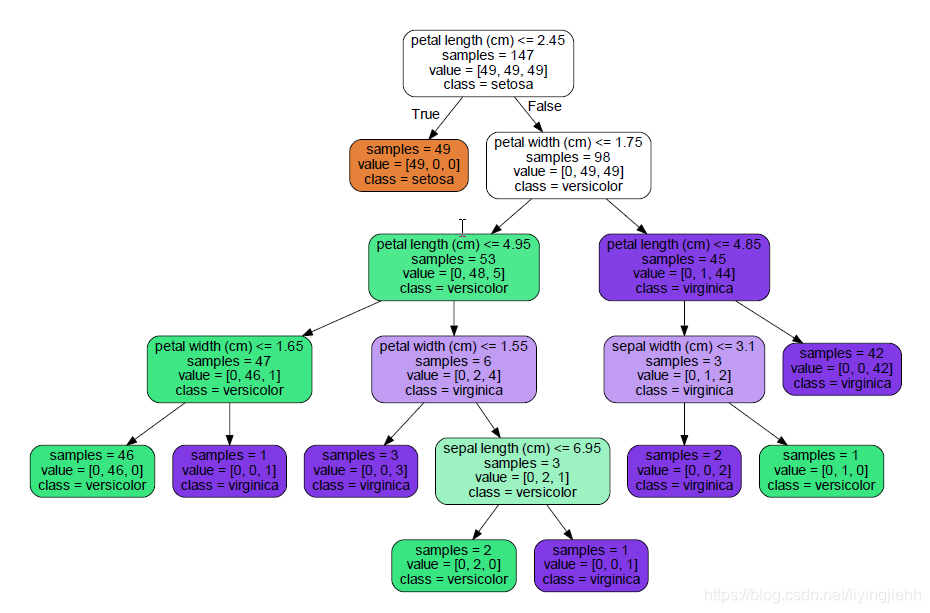
Code to draw decision tree:
# coding=utf-8

# sklearn中为我们准备的数据-iris
# iris有三种鸢尾花,山鸢尾花,变色鸢尾和维吉尼亚鸢尾
# 数据中有4个特征(feature)
# sepal length (花萼长度)
# sepal width (花萼宽度)
# petal lenth (花瓣长度)
# petal width (花瓣宽度)
from sklearn.datasets import load_iris
from sklearn import tree
import numpy as np

# 获取鸢尾数据
iris = load_iris()

# 用来做测试的数据下标
test_idx = [0,50,100]

# 用以训练的数据
train_target = np.delete(iris.target,test_idx)
train_data = np.delete(iris.data,test_idx,axis=0)

# 用以测试的数据
test_target = iris.target[test_idx]
test_data = iris.data[test_idx]


# 决策树
clf = tree.DecisionTreeClassifier()
clf.fit(train_data,train_target)

# 打印出测试数据和决策树的预言数据
# 结果应该是一样的(即决策树能正确预测)
print ("test_target:")
print (test_target)
print ("predict:")
print (clf.predict(test_data))


# 将决策树可视化
# 需要pydot(我安装了兼容版本pydotplus)
# 同时需要Graphviz(请去官网www.graphviz.org下载)
from sklearn.externals.six import StringIO
import pydotplus

dot_data = StringIO()
tree.export_graphviz(clf,
                        out_file=dot_data,
                        feature_names=iris.feature_names,
                        class_names=iris.target_names,
                        filled=True,rounded=True,
                        impurity=False)

graph = pydotplus.graph_from_dot_data(dot_data.getvalue())
# 输出pdf,显示整个决策树的思维过程
graph.write_pdf("viz.pdf")
the decision tree is :
Reference
[1] http://blog.51cto.com/12482328/2105558
[2] https://blog.youkuaiyun.com/lanchunhui/article/details/51140053
[3] http://www.cnblogs.com/pinard/p/6050306.html


 1191
1191

 被折叠的 条评论
为什么被折叠?
被折叠的 条评论
为什么被折叠?
 到【灌水乐园】发言


