


 本文详细介绍了如何在MySQL/MariaDB中配置慢日志和错误日志,包括查看慢SQL是否开启、配置my.cfg文件、设置慢SQL的时间阈值、指定慢SQL日志和错误日志文件等关键步骤。通过理解慢查询日志字段的意义,可以有效定位并优化慢查询问题。
mysql/mariadb 慢日志错误日志配置
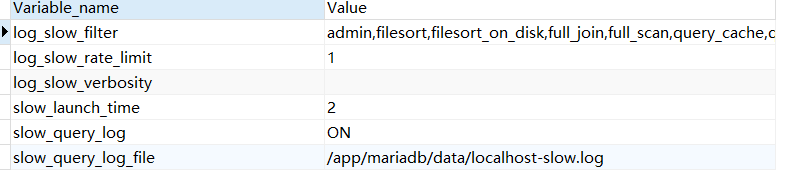
先查看慢sql是否开启
mysql> show variables like “%slow%”;
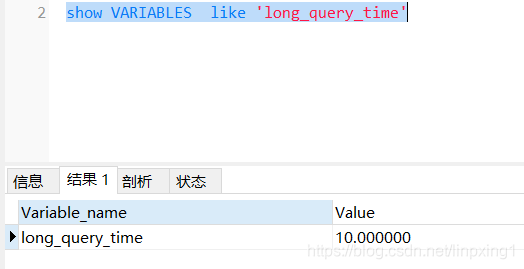
show VARIABLES like ‘%long_query_time%’
查询Mysql的进程
[root@localhost rc.d]# ps -ef | grep mysql
root      6096     1  0 17:19 ?        00:00:00 /bin/sh /usr/local/mariadb/bin/mysqld_safe --datadir=/app/mariadb/data --pid-file=/app/mariadb/data/localhost.localdomain.pid
mysql     6231  6096 29 17:19 ?        00:02:24 /usr/local/mariadb/bin/mysqld --basedir=/usr/local/mariadb --datadir=/app/mariadb/data --plugin-dir=/usr/local/mariadb/lib/plugin --user=mysql --log-error=/app/mariadb/data/localhost.localdomain.err --pid-file=/app/mariadb/data/localhost.localdomain.pid --socket=/tmp/mysql.sock --port=3306
1,找到目录 /app/mariadb/,即mysql的软件目录
2,配置my.cfg,一般文件在 /etc/my.cfg
增加配置# The MySQL server
[mysqld]
port            = 3306
socket          = /tmp/mysql.sock
skip-external-locking
key_buffer_size = 384M
max_allowed_packet = 1M
table_open_cache = 512
sort_buffer_size = 2M
read_buffer_size = 2M
read_rnd_buffer_size = 8M
myisam_sort_buffer_size = 64M
thread_cache_size = 8
query_cache_size = 32M
# Try number of CPU's*2 for thread_concurrency
thread_concurrency = 8
max_connections=500
## 慢sql开关
slow_query_log = ON
## 定义慢sql的时间,比如超过10s算是
long_query_time = 10
## 慢sql日志目录
slow_query_log_file=/app/mariadb/data/localhost-slow.log
## 错误和警告日志文件指定,一般mysql是不会指定的
log-error=/app/mariadb/data/localhost.localdomain.err
注意指定的目录要有写的权限
慢sql的字段说明:
cat /app/mariadb/data/localhost-slow.log
# Time: 200729 15:42:35
# User@Host: root[root] @  [192.168.9.82]
# Thread_id: 3151  Schema: parkcloud_performancetest  QC_hit: No
# Query_time: 10.932336  Lock_time: 0.000091  Rows_sent: 5  Rows_examined: 9022
# Rows_affected: 0
SET timestamp=1596008555;
字段意义解析:
第一行,SQL查询执行的时间
第二行,执行SQL查询的连接信息,用户和连接IP
第三行,记录了一些我们比较有用的信息,如下解析:
- Query_time,这条SQL执行的时间,越长则越慢
- Lock_time,在MySQL服务器阶段(不是在存储引擎阶段)等待表锁时间
- Rows_sent,查询返回的行数
- Rows_examined,查询检查的行数,越长就当然越费时间
- -Rows_affected,影响的行数
查询的完整sql


 795
795

 被折叠的 条评论
为什么被折叠?
被折叠的 条评论
为什么被折叠?
 到【灌水乐园】发言


