


 Datadog是一款针对云规模应用的监控服务,提供统一视图展现来自服务器、数据库、工具和服务的数据。支持多种云服务提供商,如AWS、Azure等,并具备直观的仪表板、有效的警报以及关键指标的可视化。
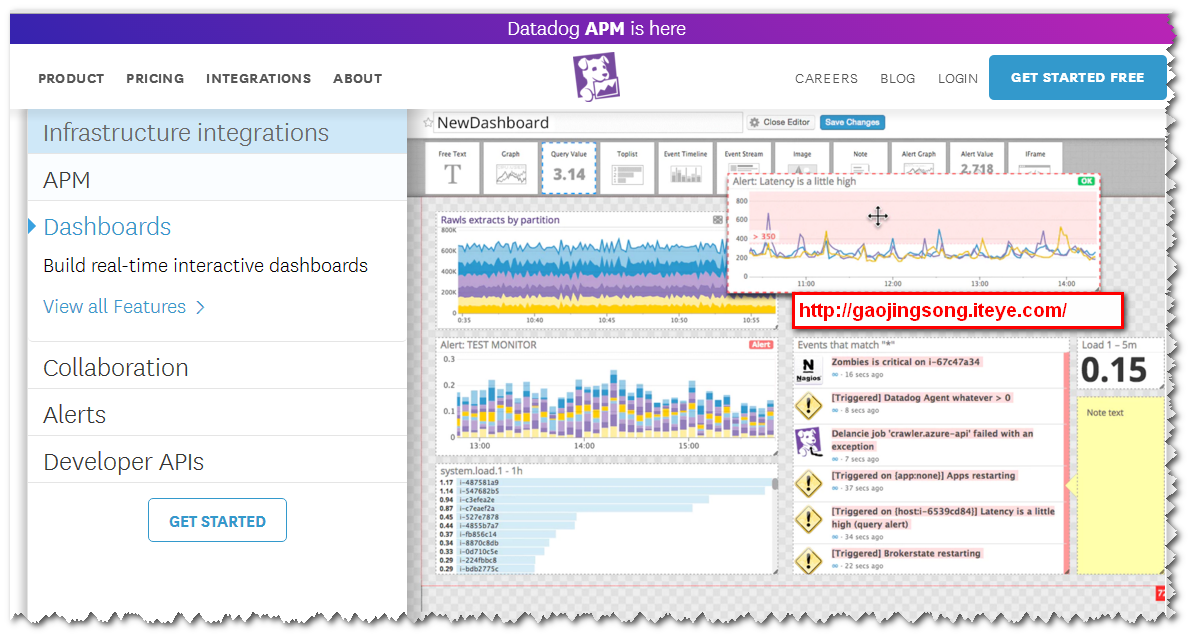
Datadog is a monitoring service for cloud-scale applications, bringing together data from servers, databases, tools, and services to present a unified view of an entire stack. These capabilities are provided on a SaaS-based data analytics platform.
Datadog 允许你以单个主机、服务、流程和度量来构建图形和警告,或者使用它们的几乎任何组合构建。例如,你可以监控你的所有主机,或者某个特定可用区域的所有NGINX主机,或者您可以监视具有特定标签的所有主机的一个关键指标。
Technology
Datadog uses a Python based, open-source agentforked from the original created in 2009 by David Mytton for Server Density (previously called Boxed Ice). Its backend is built using a number of open and closed source technologies including D3, Apache Cassandra, Kafka, PostgreSQL, etc.
In 2014, Datadog support was broadened to multiple cloud service providers including Amazon Web Services (AWS), Microsoft Azure, Google Cloud Platform and Red Hat OpenShift. Today, the company supports over 150 integrations out-of-the-box.
History
Datadog was founded in 2010 by Olivier Pomel and Alexis Lê-Quôc, who met while working at Wireless Generation. After Wireless Generation was acquired by NewsCorp, the two set out to create a product that could reduce the friction they experienced between developer and system-admin teams, who were often working at cross-purposes.
They built Datadog to be a complete cloud infrastructure monitoring service, with an intuitive dashboard, effective alerting, and helpful visualizations of key metrics. As cloud adoption increased, Datadog grew rapidly and expanded its product offering to cover service providers including Amazon Web Services (AWS), Microsoft Azure, Google Cloud Platform, Red Hat OpenShift, and OpenStack.
In 2015 Datadog announced the acquisition of Mortar Data, bringing on its team and adding its data and analytics capabilities to Datadog’s platform. That year Datadog also opened a research and development office in Paris, putting its resources towards developing new technologies and services for its customers.
In 2016 Datadog moved its New York City headquarters to a full floor of the New York Times Building to support its growing team,which doubled over the course of the year. Datadog further cemented its leadership position in the cloud monitoring space with the beta-release of Application Performance Monitoring in 2016, offering for the first time a full-stack monitoring solution.


 679
679

 被折叠的 条评论
为什么被折叠?
被折叠的 条评论
为什么被折叠?
 到【灌水乐园】发言


