


【qwt下载地址】
qwt - Browse Files at SourceForge.net
【编译】
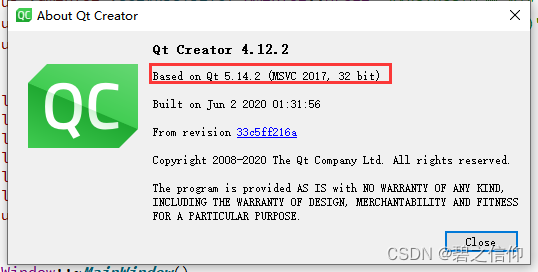
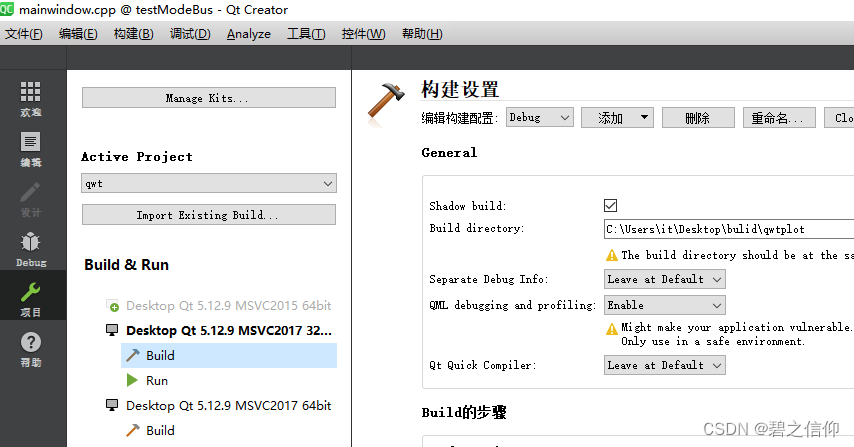
由于本人用的是qt 5.12.9。Qtcretor对应的版本是msvc2017 32选择msvc2017 32位编译.
对于Qt Creator编译编译工具可以在关于中看到
这是编译好的控件库
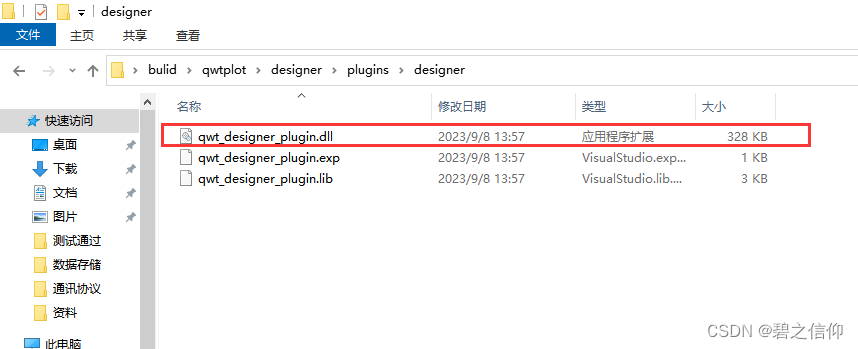
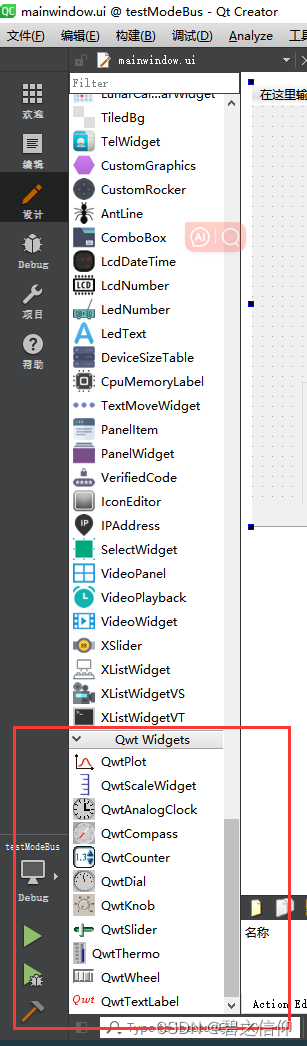
【使用控件库】
将编译好的控件dll文件放入qtcreator此目录下控件库这样就可以在控件设计里看见控件了
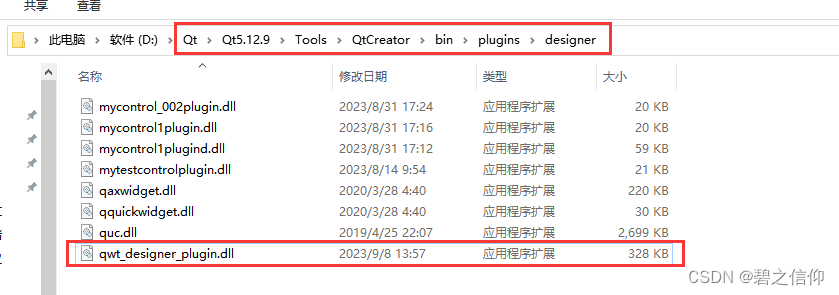
重新打开QtCreator即可看见qwt控件
【引入库文件】
再将qwt编译一遍,如果使用的工程是mingw就用mingw编,如果使用msvc就用msvc编。
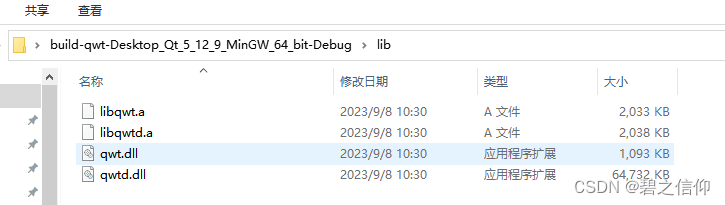
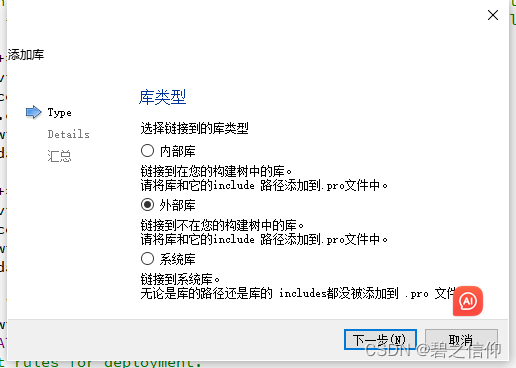
将libqwt.a或libqwtd.a加入工程
在工程文件.pro点击右键,选择添加库
【编程】
#include <qwt_plot_curve.h>
#include <qwt_plot.h>
#include <qwt_plot_grid.h>
#include <qwt_symbol.h>
#include <qwt_legend.h>
#include <qwt_legend_label.h>
ui->qwtPlot->setAxisTitle( QwtPlot::xBottom, "Points" );
ui->qwtPlot->setAxisScale( QwtPlot::xBottom, 0, 250,50);
ui->qwtPlot->setAxisScale( QwtPlot::yLeft, -50, 50,10);
ui->qwtPlot->setAxisScale( QwtPlot::yRight,- 50, 50,10);
ui->qwtPlot->setAxisTitle( QwtPlot::yLeft, "XValues" );
ui->qwtPlot->setAxisTitle( QwtPlot::yRight, "YValues" );
ui->qwtPlot->enableAxis(QwtPlot::yRight,true);
//设置底部标题
//设置底部刻度尺
//设置左纵轴刻度尺
//设置右纵轴刻度尺
//设置左纵轴标题
//设置右纵轴标题
//使能右纵轴
QwtPlotCurve line1;
QwtPlotCurve line2;
QVector<double>xbase;
QVector<double> pointsx;
QVector<double> pointsy;
line1.setPen(Qt::red,2);
line2.setPen(Qt::blue,2);
for(int i=0;i<=250;i++)
{
xbase.append(i);
pointsx.append(0);
pointsy.append(0);
}
line1.attach(ui->qwtPlot);
line2.attach(ui->qwtPlot);
line1.setYAxis(QwtPlot::yLeft);
line2.setYAxis(QwtPlot::yRight);
line1.setSamples(xbase,pointsx);
line2.setSamples(xbase,pointsy);
ui->qwtPlot->replot();
画新曲线的时候更新pointsx,pointsy里的值,然后setSample。然后replot。


 1万+
1万+

 被折叠的 条评论
为什么被折叠?
被折叠的 条评论
为什么被折叠?
 到【灌水乐园】发言


