


目录
一。人口分析项目实现
import numpy as np
import pandas as pd
from pandas import DataFrame
abb=pd.read_csv("./state-abbrevs.csv")
# print(abb.head())
area=pd.read_csv("./state-areas.csv")
# print(area.head())
pop=pd.read_csv("./state-population.csv")
# print(pop.head())

abb_pop=pd.merge(abb,pop,left_on="abbreviation",right_on="state/region",how="outer")#合并abb和pop,用merge方法并设置为outer;join和merge的区别在于合并标准是行还是列,inner和outer的区别在于是交集还是并集
# print(abb_pop.head())

abb_pop.drop(labels="abbreviation",axis=1,inplace=True)#drop中axis=0为行,其他axis=0为列
# print(abb_pop.head())
# print("*"*100)

#查看存在缺失数据的列
# print(abb_pop.isnull().any(axis=0)) #state,population两列中存在空值;drop中0为行,其他0为列
# print(abb_pop.info())

# print(abb_pop[abb_pop["state"].isnull()])
# print(abb_pop[abb_pop["state"].isnull()]["state/region"].unique())

#fillna可以使用空的紧邻值或者指定的值做填充
#可以使用给元素赋值的方式进行填充
indexs=abb_pop[abb_pop["state/region"]=="USA"].index#将usa对应的行数据取出
# print(indexs)
abb_pop.loc[indexs,"state"]="United States"
# print(abb_pop[abb_pop["state/region"]=="USA"])

# print(abb_pop[abb_pop["state/region"]=="PR"])
indexs=abb_pop[abb_pop["state/region"]=="PR"].index
abb_pop.loc[indexs,"state"]="PPPRRR"
# abb_pop[abb_pop["state/region"]=="PR"]["state"]="PPPRRR"  #此操作错误
# print(abb_pop[abb_pop["state/region"]=="PR"])
#

abb_pop_area=pd.merge(abb_pop,area,how="outer",on="state")#因为只有一个列索引相同,此处的on可以省略
print(abb_pop.head())
print(area.head())
print(abb_pop_area.head())
indexs=abb_pop_area.loc[abb_pop_area["area (sq. mi)"].isnull()].index
print(abb_pop_area["area (sq. mi)"].isnull().head())
abb_pop_area.drop(labels=indexs,axis=0,inplace=True)#label在列的方向上选出了多行;drop中0为行,其他0位列;drop删除行

print(abb_pop_area.query('ages=="total"&year==2010')["year"].head())
print(abb_pop_area.query('ages=="total"&year==2010')["ages"].head())

print(abb_pop_area["population"]/abb_pop_area["area (sq. mi)"].head()) #算出的是人口密度
abb_pop_area["midu"]=abb_pop_area["population"]/abb_pop_area["area (sq. mi)"]
print(abb_pop_area.head())

print(abb_pop_area.sort_values(by="midu",axis=0,ascending=False).head())#drop中0为行,其他0位列
/Users/lichengxiang/opt/anaconda3/bin/python /Users/lichengxiang/Desktop/python/数据分析/数据分析项目合集/人口分析项目实现.py
state state/region ages year population
0 Alabama AL under18 2012 1117489.0
1 Alabama AL total 2012 4817528.0
2 Alabama AL under18 2010 1130966.0
3 Alabama AL total 2010 4785570.0
4 Alabama AL under18 2011 1125763.0
state area (sq. mi)
0 Alabama 52423
1 Alaska 656425
2 Arizona 114006
3 Arkansas 53182
4 California 163707
state state/region ages year population area (sq. mi)
0 Alabama AL under18 2012.0 1117489.0 52423.0
1 Alabama AL total 2012.0 4817528.0 52423.0
2 Alabama AL under18 2010.0 1130966.0 52423.0
3 Alabama AL total 2010.0 4785570.0 52423.0
4 Alabama AL under18 2011.0 1125763.0 52423.0
0 False
1 False
2 False
3 False
4 False
Name: area (sq. mi), dtype: bool
3 2010.0
91 2010.0
101 2010.0
189 2010.0
197 2010.0
Name: year, dtype: float64
3 total
91 total
101 total
189 total
197 total
Name: ages, dtype: object
0 21.316769
1 91.897221
2 21.573851
3 91.287603
4 21.474601
...
2444 NaN
2445 NaN
2446 NaN
2447 NaN
2544 NaN
Length: 2449, dtype: float64
state state/region ages year population area (sq. mi) midu
0 Alabama AL under18 2012.0 1117489.0 52423.0 21.316769
1 Alabama AL total 2012.0 4817528.0 52423.0 91.897221
2 Alabama AL under18 2010.0 1130966.0 52423.0 21.573851
3 Alabama AL total 2010.0 4785570.0 52423.0 91.287603
4 Alabama AL under18 2011.0 1125763.0 52423.0 21.474601
state state/region ... area (sq. mi) midu
391 District of Columbia DC ... 68.0 9506.602941
385 District of Columbia DC ... 68.0 9315.102941
387 District of Columbia DC ... 68.0 9112.117647
431 District of Columbia DC ... 68.0 8901.779412
389 District of Columbia DC ... 68.0 8898.897059
[5 rows x 7 columns]
进程已结束,退出代码0
二。政治献金项目数据分析
import numpy as np
import pandas as pd
from pandas import DataFrame
df=pd.read_csv("./usa_election.txt")
print(df.info())
print(df.describe())
df.fillna(value="NOT PROVIDE",inplace=True)
print(df.info())
print(df.head())
drop_indexs=df[df["contb_receipt_amt"]<=0].index
df.drop(labels=drop_indexs,axis=0,inplace=True)
months = {'JAN' : 1,'FEB' : 2,'MAR': 3,'APR' : 4, 'MAY' : 5, 'JUN' : 6,"JUL":7,"AUG":8,"SEP":9,"OCT":10,"NOV":11,"DEC":12}
of_interest = ['Obama, Barack','Romney, Mitt',"Santorum, Rick",'Paul, Ron','Gingrich, Newt']
parties = {
'Bachmann, Michelle': 'Republican',
'Romney, Mitt': 'Republican',
'Obama, Barack':'Democrat',
"Roemer, Charles E.'Buddy' III": 'Reform',
'Pawlenty, Timothy': 'Republican',
'Johnson, Gary Earl': 'Libertarian',
'Paul, Ron': 'Republican',
'Santorum, Rick': 'Republican',
'Cain, Herman': 'Republican',
'Gingrich, Newt': 'Republican',
'McCotter, Thaddeus G': 'Republican',
'Huntsman, Jon': 'Republican',
'Perry, Rick':'Republican'}
df["party"]=df["cand_nm"].map(parties) #用map做运算,做配对
df["party"].unique()
df["party"].value_counts()#统计party列中各个元素出现的次数
df.groupby(by="party")["contb_receipt_amt"].sum()#生成一个以党派值为索引的series,统计各个党派的"contb_receipt_amt"的和
df.groupby(by=["contb_receipt_dt","contb_receipt_amt"])["contb_receipt_amt"].sum()

def transformData(d):
    day,month,year=d.split("-")
    month=months[month]#将英文形式的月份转换成了数字形式的月份
    return "20"+year+"-"+str(month)+"-"+day
# df["contb_receipt_dt"]=df["contb_receipt_dt"].apply(transformData)
df["contb_receipt_dt"]=df["contb_receipt_dt"].map(transformData)#df["contb_receipt_dt"]为一个series,用map将每一行的值传入函数中并返回新值;最后再用原series接收
print(df["contb_receipt_dt"].head())

df_old=df[df["contbr_occupation"]=="DISABLED VETERAN"]
print(df_old.groupby(by="cand_nm")["contb_receipt_amt"].sum())#生成一个以"cand_nm"为索引的series,统计各个"cand_nm"值的"contb_receipt_amt"的和
/Users/lichengxiang/opt/anaconda3/bin/python /Users/lichengxiang/Desktop/python/数据分析/数据分析项目合集/政治献金项目数据分析.py
sys:1: DtypeWarning: Columns (6) have mixed types.Specify dtype option on import or set low_memory=False.
<class 'pandas.core.frame.DataFrame'>
RangeIndex: 536041 entries, 0 to 536040
Data columns (total 16 columns):
 #   Column             Non-Null Count   Dtype
---  ------             --------------   -----
 0   cmte_id            536041 non-null  object
 1   cand_id            536041 non-null  object
 2   cand_nm            536041 non-null  object
 3   contbr_nm          536041 non-null  object
 4   contbr_city        536026 non-null  object
 5   contbr_st          536040 non-null  object
 6   contbr_zip         535973 non-null  object
 7   contbr_employer    525088 non-null  object
 8   contbr_occupation  530520 non-null  object
 9   contb_receipt_amt  536041 non-null  float64
 10  contb_receipt_dt   536041 non-null  object
 11  receipt_desc       8479 non-null    object
 12  memo_cd            49718 non-null   object
 13  memo_text          52740 non-null   object
 14  form_tp            536041 non-null  object
 15  file_num           536041 non-null  int64
dtypes: float64(1), int64(1), object(14)
memory usage: 65.4+ MB
None
       contb_receipt_amt       file_num
count       5.360410e+05  536041.000000
mean        3.750373e+02  761472.107800
std         3.564436e+03    5148.893508
min        -3.080000e+04  723511.000000
25%         5.000000e+01  756218.000000
50%         1.000000e+02  763233.000000
75%         2.500000e+02  763621.000000
max         1.944042e+06  767394.000000
<class 'pandas.core.frame.DataFrame'>
RangeIndex: 536041 entries, 0 to 536040
Data columns (total 16 columns):
 #   Column             Non-Null Count   Dtype
---  ------             --------------   -----
 0   cmte_id            536041 non-null  object
 1   cand_id            536041 non-null  object
 2   cand_nm            536041 non-null  object
 3   contbr_nm          536041 non-null  object
 4   contbr_city        536041 non-null  object
 5   contbr_st          536041 non-null  object
 6   contbr_zip         536041 non-null  object
 7   contbr_employer    536041 non-null  object
 8   contbr_occupation  536041 non-null  object
 9   contb_receipt_amt  536041 non-null  float64
 10  contb_receipt_dt   536041 non-null  object
 11  receipt_desc       536041 non-null  object
 12  memo_cd            536041 non-null  object
 13  memo_text          536041 non-null  object
 14  form_tp            536041 non-null  object
 15  file_num           536041 non-null  int64
dtypes: float64(1), int64(1), object(14)
memory usage: 65.4+ MB
None
     cmte_id    cand_id             cand_nm  ...    memo_text form_tp file_num
0  C00410118  P20002978  Bachmann, Michelle  ...  NOT PROVIDE   SA17A   736166
1  C00410118  P20002978  Bachmann, Michelle  ...  NOT PROVIDE   SA17A   736166
2  C00410118  P20002978  Bachmann, Michelle  ...  NOT PROVIDE   SA17A   749073
3  C00410118  P20002978  Bachmann, Michelle  ...  NOT PROVIDE   SA17A   749073
4  C00410118  P20002978  Bachmann, Michelle  ...  NOT PROVIDE   SA17A   736166

[5 rows x 16 columns]
0    2011-6-20
1    2011-6-23
2    2011-7-05
3    2011-8-01
4    2011-6-20
Name: contb_receipt_dt, dtype: object
cand_nm
Cain, Herman       300.00
Obama, Barack     4205.00
Paul, Ron         2425.49
Santorum, Rick     250.00
Name: contb_receipt_amt, dtype: float64

进程已结束,退出代码0
三。用户数据分析
import numpy as np
import pandas as pd
from matplotlib import pyplot as plt
from pandas import DataFrame
df = pd.read_csv("./CDNOW_master.txt",header=None,sep="\s+",names=["user_id", "order_dt", "oder_product", "order_amount"])#sep="\s+"以多个空格为分隔符将数据将每行数据划分为多个部分
print(df)
print(df.info())
df["order_dt"] = pd.to_datetime(df["order_dt"], format="%Y%m%d")#将"order_dt"一列转化为了时间格式,从"19970101"到"1997-01-01"
print(df.info())
print(df.describe())
print("*"*100)
print(df.head())
df["month"] = df["order_dt"].astype("datetime64[M]")#".astype("datetime64[M]")"将时间规格定为月,"1997-01-12"变为"1997-01-01"
print(df.head())
# print(df.groupby(by="month")["order_amount"].sum()) #series类型
# print(type(df.groupby(by="month")["order_amount"].sum()))
# plt.figure(figsize=(20,8),dpi=80)
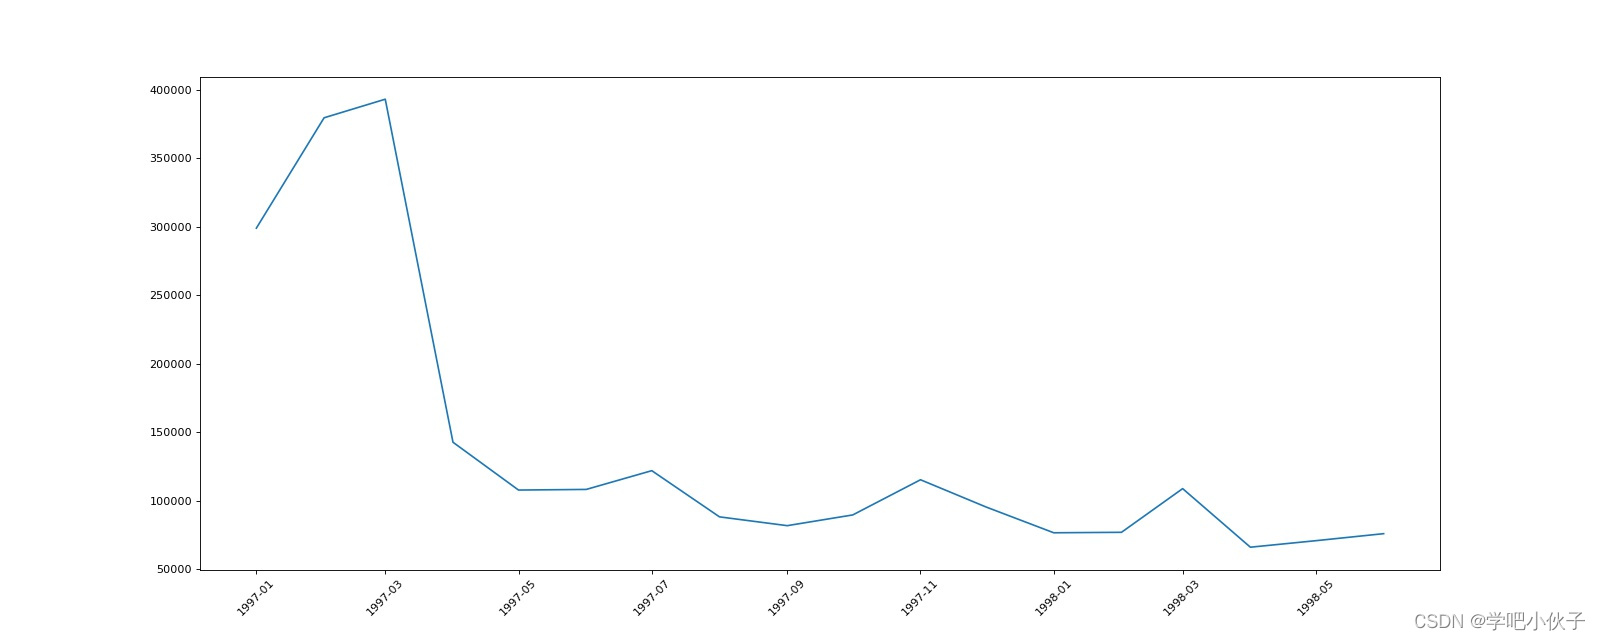
# plt.plot(df.groupby(by="month")["order_amount"].sum())
# # df.groupby(by="month")["order_amount"].sum().plot()
# plt.xticks(rotation=45)
# plt.savefig("./用户每月花费的总金额.jpg")
# plt.show()
# plt.figure(figsize=(20,8),dpi=80)
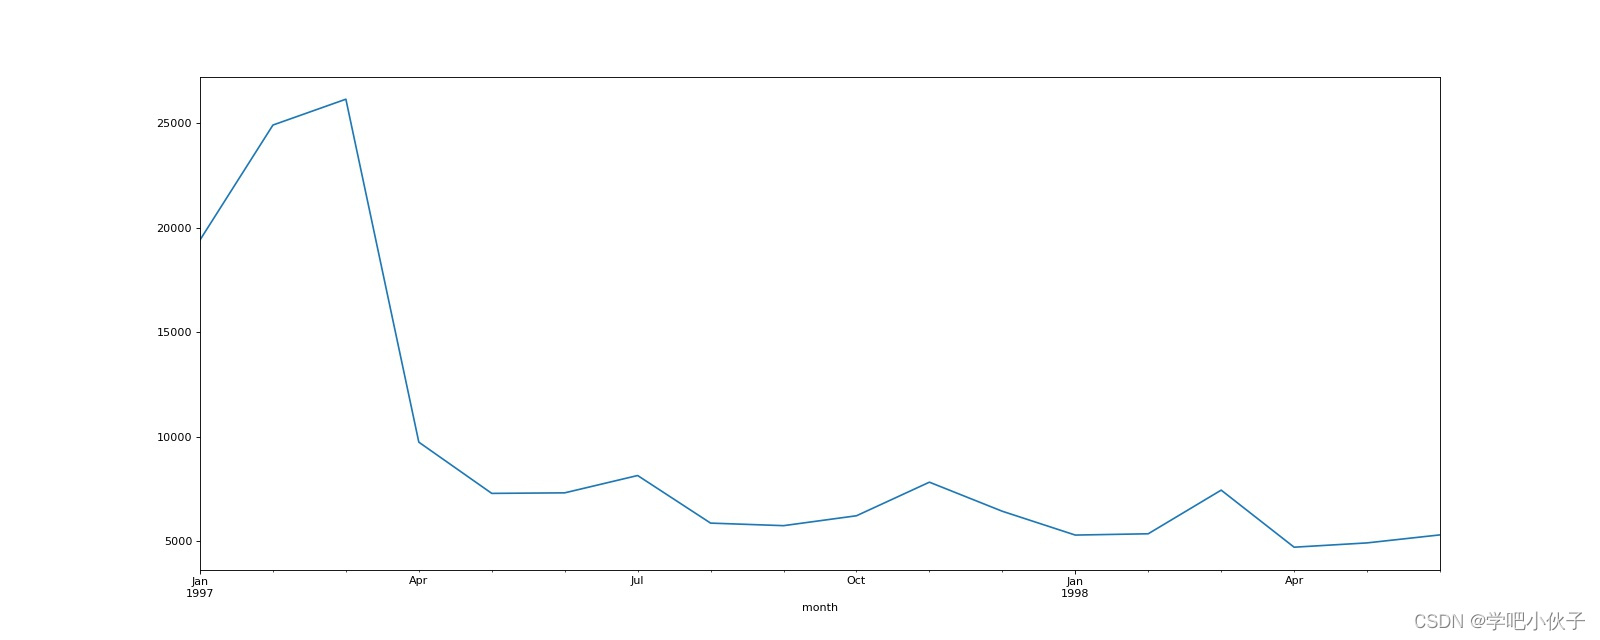
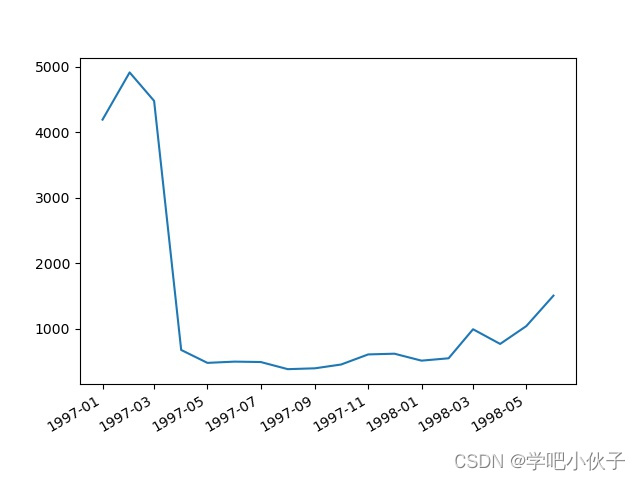
# df.groupby(by="month")["oder_product"].sum().plot() #可以通过这种方式直接绘图,以series的索引为x值,以series的值为y值;折线图
# plt.savefig("./所有用户每月的产品购买量.jpg")
# plt.show()
print(df.groupby(by="month")["user_id"].count()) # 统计每个月的消费次数
print(df.groupby(by="month")["user_id"].nunique()) # 统计每月的消费人数,nunique表示统计去重后的个数
print(df.groupby(by="user_id")["order_amount"].sum()) # 每一个用户消费的总金额
print(df.groupby(by="user_id").count()["order_dt"])
# user_amount_sum=df.groupby(by="user_id")["order_amount"].sum() #series类型,索引为"user_id",值为每个"user_id"下"order_amount"的和
# print(user_amount_sum)
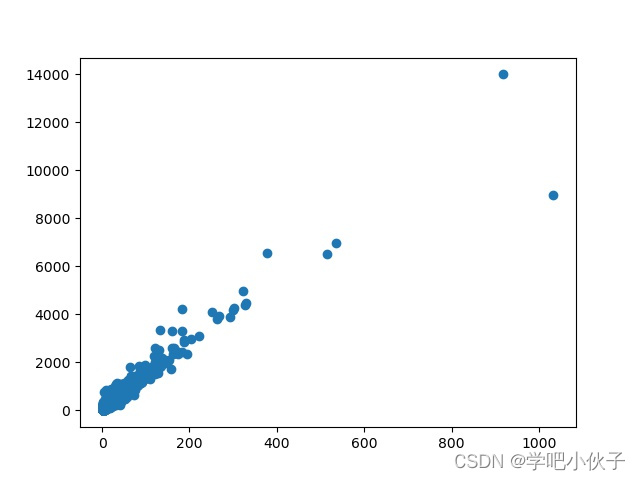
# user_product_sum=df.groupby(by="user_id")["oder_product"].sum() #series类型
# plt.scatter(user_product_sum,user_amount_sum) #散点图
# plt.savefig("./用户消费产品数量和消费金额的散点图.jpg")
# plt.show()
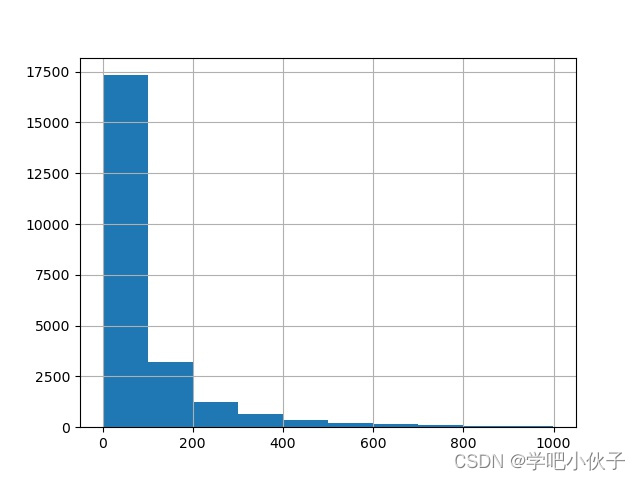
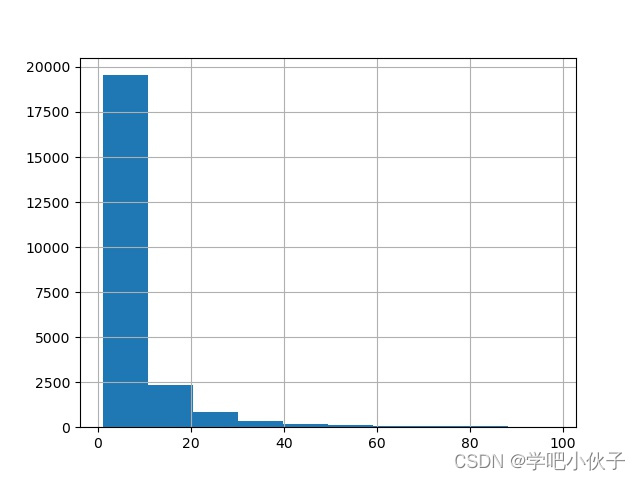
# df.groupby(by="user_id").sum().query("order_amount<=1000")["order_amount"].hist()#直方图,横坐标为"order_amount"的值的范围,纵坐标为在这个值的范围内的"user_id"的个数
# plt.savefig("./各个用户消费总金额的直方分布图.jpg")
# plt.show()
# df.groupby(by="user_id").sum().query("oder_product<=100")["oder_product"].hist()
# plt.savefig("./各个用户消费总数量的直方分布图.jpg")
# plt.show()
# print(df.groupby(by="user_id")["month"].min())#用户第一次消费的月份,series类型
# print(df.groupby(by="user_id")["month"].min().value_counts())#对于不同月份的人数的统计,value_counts中的value就是指的月份
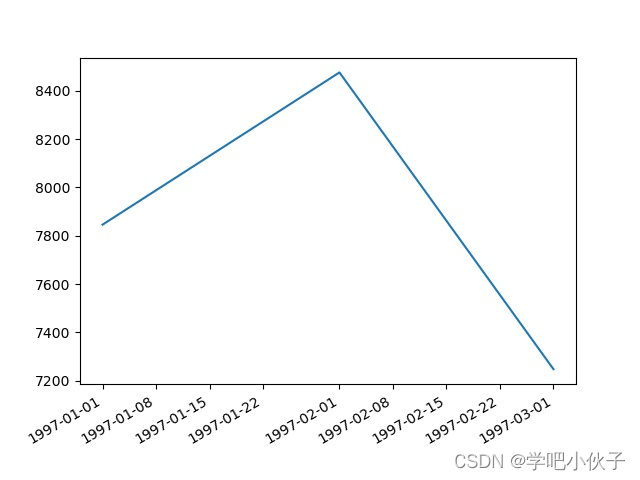
# df.groupby(by="user_id")["month"].min().value_counts().plot()
# plt.savefig("./第一次消费的月份和人数的统计.jpg")
# plt.show()
# df.groupby(by="user_id")["month"].max().value_counts().plot()
# plt.savefig("./最后一次消费的月份和人数的统计.jpg")
# plt.show()
print(df.groupby(by="user_id")["order_dt"].agg(["min", "max"])) # agg对分组之后的结果进行多种指定聚合
new_old_user_df = df.groupby(by="user_id")["order_dt"].agg(["min", "max"])
print((new_old_user_df["min"] == new_old_user_df["max"]).value_counts())
print("--"*60)
rfm = df.pivot_table(index="user_id", aggfunc={"order_amount": "sum", "oder_product": "sum", "order_dt": "max"})#透视表,index指明透视表的行索引,aggfunc以字典的方式指明不同的colunm值中采用了不同的方法
print(rfm.head())
rfm = pd.DataFrame(rfm, columns=["order_amount", "oder_product", "order_dt"])#pd.DataFrame可以重新对rfm的列顺序进行调整
print(rfm.head())
max_dt = df["order_dt"].max() # 今天的时间
print(-(df.groupby(by="user_id")["order_dt"].max() - max_dt))
rfm["R"] = -(df.groupby(by="user_id")["order_dt"].max() - max_dt) / np.timedelta64(1, "D")#np.timedelta64(1, "D")将"545 days"转化为545
rfm.drop(labels="order_dt", axis=1, inplace=True)
rfm.columns = ["M", "F", "R"]
print("*" * 100)
print(rfm)
def rfm_func(x): # x传入的是一行
# 存储存储的是三个字符串形式的0或者1
level = x.map(lambda x: '1' if x >= 0 else "0") # map做运算,是series运算工具;map操作对一行的每个值进行了重新赋值;level代表的是某一行,x代表该行中的各个值
label = level.R + level.F + level.M
d = {
'111': '重要价值客户',
'011': '重要保持客户',
'101': '重要挽留客户',
'001': '重要发展客户',
'110': '一般价值客户',
'010': '一般保持客户',
'100': '一般挽留客户',
'000': '一般发展客户'
}
result = d[label]
return result # 对每一行返回了一个值
# df.apply(func):可以对df中的行或者列进行某种 (func)形式的运算
rfm['label'] = rfm.apply(lambda x: x - x.mean(), axis=0).apply(rfm_func, axis=1) # apply是dataframe中的运算工具,注意axis值的变化
print("-*"*60)
print(rfm.head())
# print(df.pivot_table(index="user_id",values="order_dt",aggfunc="count",columns="month").fillna(0))
user_month_count_df = df.pivot_table(index="user_id", values="order_dt", aggfunc="count", columns="month").fillna(0)#pivot_table指透视表,index为透视表行索引,aggfunc对values指定的值进行操作,columns设置列索引并规定aggfunc操作范围
print(user_month_count_df.head())
df_purchase = user_month_count_df.applymap(lambda x: 1 if x >= 1 else 0) # apply对行或列进行操作,applymap对每个元素进行操作
print(df_purchase)
def active_status(data):
status = []
for i in range(18):
if data[i] == 0: # 若本月没有消费
if len(status) > 0:
if status[i - 1] == "unreg":
status.append("unreg")
else:
status.append("unactive")
else:
status.append("unreg")
# 若本月消费
else:
if len(status) == 0:
status.append('new')
else:
if status[i - 1] == "unactive":
status.append('return')
elif status[i - 1] == 'unreg':
status.append('new')
else:
status.append('active')
return status
pivoted_status = df_purchase.apply(active_status, axis=1)#传进去每一行;最后生成一个series
print(pivoted_status.head())
df_purchase_new=DataFrame(pivoted_status.values.tolist(),index=df_purchase.index,columns=df_purchase.columns)#建立DataFrame
print(df_purchase_new)
purchase_status_ct=df_purchase_new.apply(lambda x:pd.value_counts(x),axis=0).fillna(0)#axis不写默认为0
print(purchase_status_ct)
/Users/lichengxiang/opt/anaconda3/bin/python /Users/lichengxiang/Desktop/python/数据分析/数据分析项目合集/用户数据分析.py
       user_id  order_dt  oder_product  order_amount
0            1  19970101             1         11.77
1            2  19970112             1         12.00
2            2  19970112             5         77.00
3            3  19970102             2         20.76
4            3  19970330             2         20.76
...        ...       ...           ...           ...
69654    23568  19970405             4         83.74
69655    23568  19970422             1         14.99
69656    23569  19970325             2         25.74
69657    23570  19970325             3         51.12
69658    23570  19970326             2         42.96

[69659 rows x 4 columns]
<class 'pandas.core.frame.DataFrame'>
RangeIndex: 69659 entries, 0 to 69658
Data columns (total 4 columns):
 #   Column        Non-Null Count  Dtype
---  ------        --------------  -----
 0   user_id       69659 non-null  int64
 1   order_dt      69659 non-null  int64
 2   oder_product  69659 non-null  int64
 3   order_amount  69659 non-null  float64
dtypes: float64(1), int64(3)
memory usage: 2.1 MB
None
<class 'pandas.core.frame.DataFrame'>
RangeIndex: 69659 entries, 0 to 69658
Data columns (total 4 columns):
 #   Column        Non-Null Count  Dtype
---  ------        --------------  -----
 0   user_id       69659 non-null  int64
 1   order_dt      69659 non-null  datetime64[ns]
 2   oder_product  69659 non-null  int64
 3   order_amount  69659 non-null  float64
dtypes: datetime64[ns](1), float64(1), int64(2)
memory usage: 2.1 MB
None
            user_id  oder_product  order_amount
count  69659.000000  69659.000000  69659.000000
mean   11470.854592      2.410040     35.893648
std     6819.904848      2.333924     36.281942
min        1.000000      1.000000      0.000000
25%     5506.000000      1.000000     14.490000
50%    11410.000000      2.000000     25.980000
75%    17273.000000      3.000000     43.700000
max    23570.000000     99.000000   1286.010000
****************************************************************************************************
   user_id   order_dt  oder_product  order_amount
0        1 1997-01-01             1         11.77
1        2 1997-01-12             1         12.00
2        2 1997-01-12             5         77.00
3        3 1997-01-02             2         20.76
4        3 1997-03-30             2         20.76
   user_id   order_dt  oder_product  order_amount      month
0        1 1997-01-01             1         11.77 1997-01-01
1        2 1997-01-12             1         12.00 1997-01-01
2        2 1997-01-12             5         77.00 1997-01-01
3        3 1997-01-02             2         20.76 1997-01-01
4        3 1997-03-30             2         20.76 1997-03-01
month
1997-01-01     8928
1997-02-01    11272
1997-03-01    11598
1997-04-01     3781
1997-05-01     2895
1997-06-01     3054
1997-07-01     2942
1997-08-01     2320
1997-09-01     2296
1997-10-01     2562
1997-11-01     2750
1997-12-01     2504
1998-01-01     2032
1998-02-01     2026
1998-03-01     2793
1998-04-01     1878
1998-05-01     1985
1998-06-01     2043
Name: user_id, dtype: int64
month
1997-01-01    7846
1997-02-01    9633
1997-03-01    9524
1997-04-01    2822
1997-05-01    2214
1997-06-01    2339
1997-07-01    2180
1997-08-01    1772
1997-09-01    1739
1997-10-01    1839
1997-11-01    2028
1997-12-01    1864
1998-01-01    1537
1998-02-01    1551
1998-03-01    2060
1998-04-01    1437
1998-05-01    1488
1998-06-01    1506
Name: user_id, dtype: int64
user_id
1         11.77
2         89.00
3        156.46
4        100.50
5        385.61
          ...
23566     36.00
23567     20.97
23568    121.70
23569     25.74
23570     94.08
Name: order_amount, Length: 23570, dtype: float64
user_id
1         1
2         2
3         6
4         4
5        11
         ..
23566     1
23567     1
23568     3
23569     1
23570     2
Name: order_dt, Length: 23570, dtype: int64
               min        max
user_id
1       1997-01-01 1997-01-01
2       1997-01-12 1997-01-12
3       1997-01-02 1998-05-28
4       1997-01-01 1997-12-12
5       1997-01-01 1998-01-03
...            ...        ...
23566   1997-03-25 1997-03-25
23567   1997-03-25 1997-03-25
23568   1997-03-25 1997-04-22
23569   1997-03-25 1997-03-25
23570   1997-03-25 1997-03-26

[23570 rows x 2 columns]
True     12054
False    11516
dtype: int64
------------------------------------------------------------------------------------------------------------------------
         oder_product  order_amount   order_dt
user_id
1                   1         11.77 1997-01-01
2                   6         89.00 1997-01-12
3                  16        156.46 1998-05-28
4                   7        100.50 1997-12-12
5                  29        385.61 1998-01-03
         order_amount  oder_product   order_dt
user_id
1               11.77             1 1997-01-01
2               89.00             6 1997-01-12
3              156.46            16 1998-05-28
4              100.50             7 1997-12-12
5              385.61            29 1998-01-03
user_id
1       545 days
2       534 days
3        33 days
4       200 days
5       178 days
          ...
23566   462 days
23567   462 days
23568   434 days
23569   462 days
23570   461 days
Name: order_dt, Length: 23570, dtype: timedelta64[ns]
****************************************************************************************************
              M   F      R
user_id
1         11.77   1  545.0
2         89.00   6  534.0
3        156.46  16   33.0
4        100.50   7  200.0
5        385.61  29  178.0
...         ...  ..    ...
23566     36.00   2  462.0
23567     20.97   1  462.0
23568    121.70   6  434.0
23569     25.74   2  462.0
23570     94.08   5  461.0

[23570 rows x 3 columns]
-*-*-*-*-*-*-*-*-*-*-*-*-*-*-*-*-*-*-*-*-*-*-*-*-*-*-*-*-*-*-*-*-*-*-*-*-*-*-*-*-*-*-*-*-*-*-*-*-*-*-*-*-*-*-*-*-*-*-*-*
              M   F      R   label
user_id
1         11.77   1  545.0  一般挽留客户
2         89.00   6  534.0  一般挽留客户
3        156.46  16   33.0  重要保持客户
4        100.50   7  200.0  一般发展客户
5        385.61  29  178.0  重要保持客户
month    1997-01-01  1997-02-01  1997-03-01  ...  1998-04-01  1998-05-01  1998-06-01
user_id                                      ...
1               1.0         0.0         0.0  ...         0.0         0.0         0.0
2               2.0         0.0         0.0  ...         0.0         0.0         0.0
3               1.0         0.0         1.0  ...         0.0         1.0         0.0
4               2.0         0.0         0.0  ...         0.0         0.0         0.0
5               2.0         1.0         0.0  ...         0.0         0.0         0.0

[5 rows x 18 columns]
month    1997-01-01  1997-02-01  1997-03-01  ...  1998-04-01  1998-05-01  1998-06-01
user_id                                      ...
1                 1           0           0  ...           0           0           0
2                 1           0           0  ...           0           0           0
3                 1           0           1  ...           0           1           0
4                 1           0           0  ...           0           0           0
5                 1           1           0  ...           0           0           0
...             ...         ...         ...  ...         ...         ...         ...
23566             0           0           1  ...           0           0           0
23567             0           0           1  ...           0           0           0
23568             0           0           1  ...           0           0           0
23569             0           0           1  ...           0           0           0
23570             0           0           1  ...           0           0           0

[23570 rows x 18 columns]
user_id
1    [new, unactive, unactive, unactive, unactive, ...
2    [new, unactive, unactive, unactive, unactive, ...
3    [new, unactive, return, active, unactive, unac...
4    [new, unactive, unactive, unactive, unactive, ...
5    [new, active, unactive, return, active, active...
dtype: object
month   1997-01-01 1997-02-01 1997-03-01  ... 1998-04-01 1998-05-01 1998-06-01
user_id                                   ...
1              new   unactive   unactive  ...   unactive   unactive   unactive
2              new   unactive   unactive  ...   unactive   unactive   unactive
3              new   unactive     return  ...   unactive     return   unactive
4              new   unactive   unactive  ...   unactive   unactive   unactive
5              new     active   unactive  ...   unactive   unactive   unactive
...            ...        ...        ...  ...        ...        ...        ...
23566        unreg      unreg        new  ...   unactive   unactive   unactive
23567        unreg      unreg        new  ...   unactive   unactive   unactive
23568        unreg      unreg        new  ...   unactive   unactive   unactive
23569        unreg      unreg        new  ...   unactive   unactive   unactive
23570        unreg      unreg        new  ...   unactive   unactive   unactive

[23570 rows x 18 columns]
month     1997-01-01  1997-02-01  ...  1998-05-01  1998-06-01
active           0.0      1157.0  ...       459.0       446.0
new           7846.0      8476.0  ...         0.0         0.0
return           0.0         0.0  ...      1029.0      1060.0
unactive         0.0      6689.0  ...     22082.0     22064.0
unreg        15724.0      7248.0  ...         0.0         0.0

[5 rows x 18 columns]

进程已结束,退出代码0
用户每月花费的总金额.jpg
所有用户每月的产品购买量.jpg
用户消费产品数量和消费金额的散点图.jpg
各个用户消费总金额的直方分布图.jpg
各个用户消费总数量的直方分布图.jpg
第一次消费的月份和人数的统计.jpg
最后一次消费的月份和人数的统计.jpg


 被折叠的 条评论
为什么被折叠?
被折叠的 条评论
为什么被折叠?
 到【灌水乐园】发言


