


要想把波形图显示在界面上,核心思想其实很简单。
思路:先画图,然后在qtdesigner上放一个容器,给这个容器添加一个布局,然后把图当作一个Widget放入布局中。接下来看图操作,
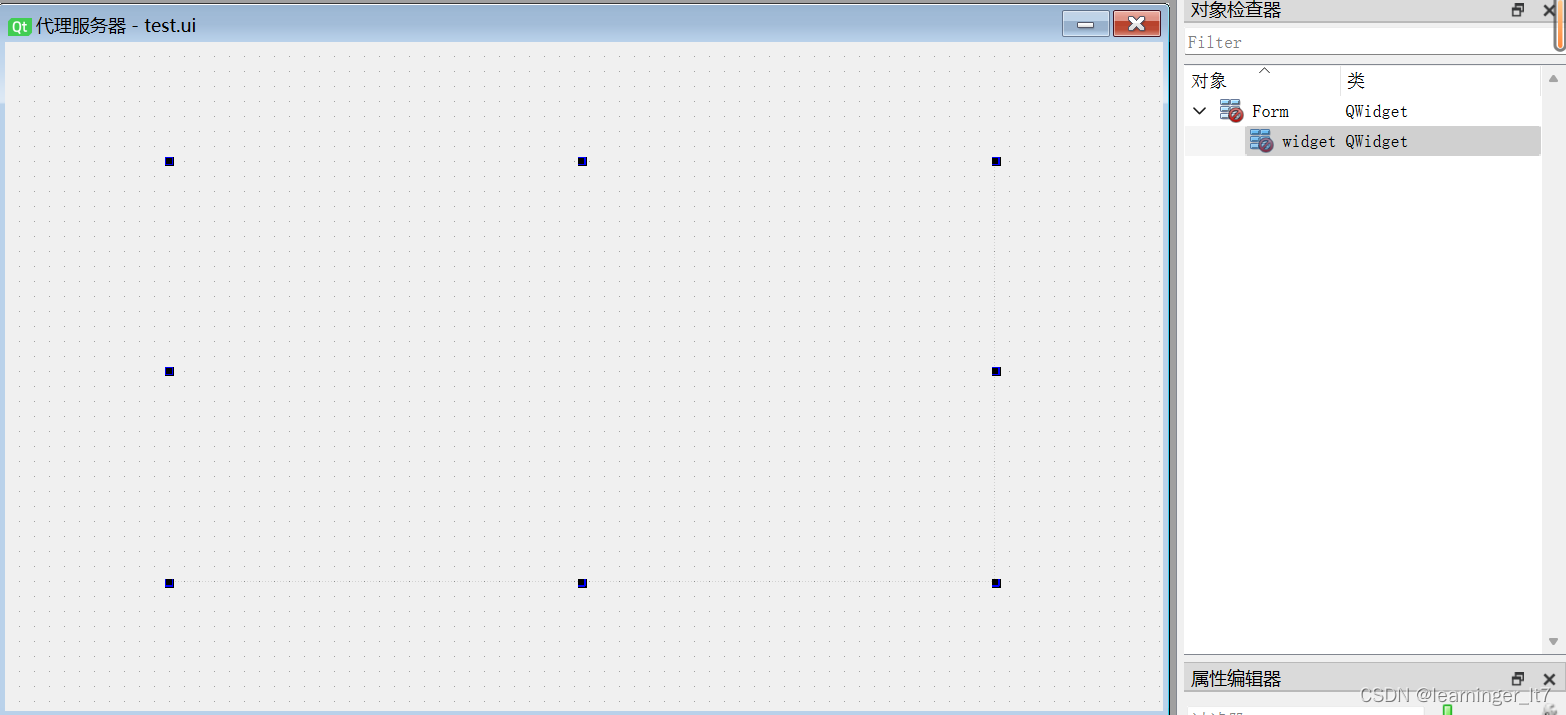
一、随便拖进来一个容器控件,我拖了一个Widget
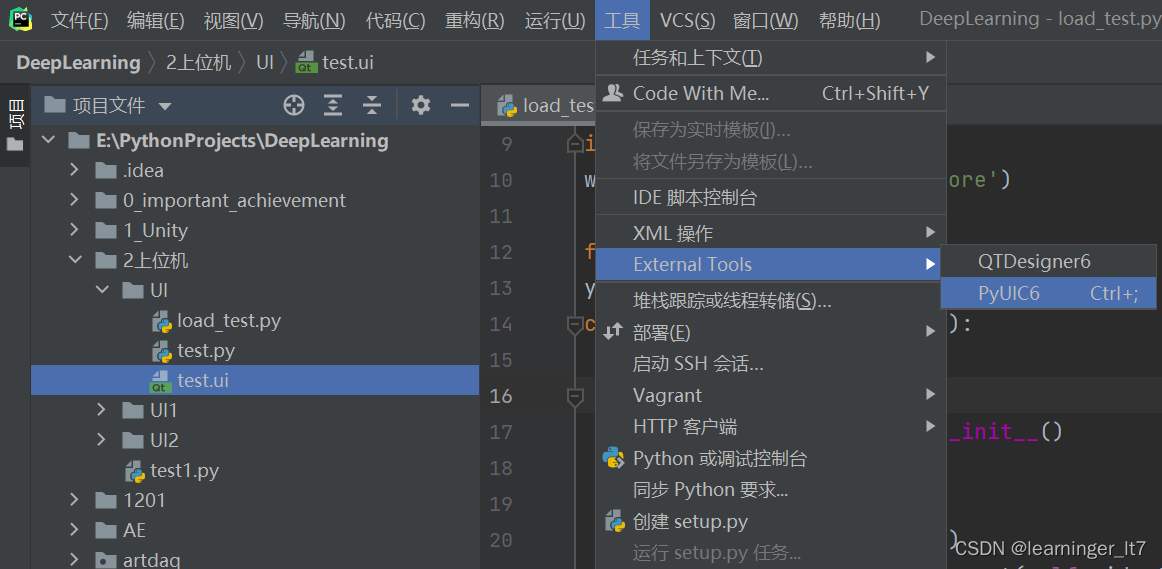
二、PyUIC把test.ui转换成test.py,再新建一个load_test.py写脚本。
三、load_test.py的代码
import sys
import numpy as np
import pyqtgraph as pg
from test import Ui_Form

import warnings
warnings.filterwarnings('ignore')

from PyQt6.QtWidgets import *

y = np.random.randn(100)

class MyApp(QWidget, Ui_Form):

    def __init__(self):
        super(MyApp, self).__init__()
        self.setupUi(self)

        self.pic = pg.plot(y)  # 画个图
        self.layout = QGridLayout(self.widget)  # 给widget添加布局,如果放入的容器自带布局,则不需要这行代码
        self.layout.addWidget(self.pic)  # 布局里面放图

if
最低0.47元/天 解锁文章


 1万+
1万+


 到【灌水乐园】发言


