


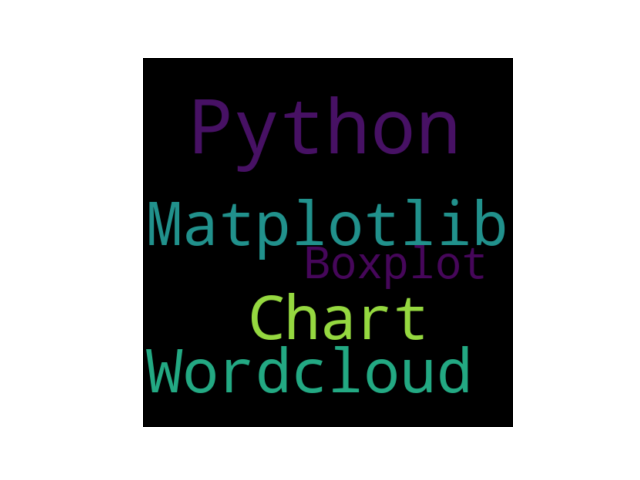
 该代码示例展示了如何利用Python的WordCloud库和Matplotlib库创建并显示一个词云图。通过设置宽度、高度和边距,生成了一个基于特定文本(包含Python、Matplotlib、Chart、Wordcloud和Boxplot等关键词)的词云,然后使用matplotlib进行无轴线显示,实现了简洁的词云数据可视化。
from wordcloud import WordCloud
import matplotlib.pyplot as plt
# 添加词语
text = ("Python Matplotlib Chart Wordcloud Boxplot")
# 创建词云对象
wordcloud = WordCloud(width=480, height=480, margin=0).generate(text)
# 显示词云图
plt.imshow(wordcloud, interpolation='bilinear')
plt.axis("off")
plt.margins(x=0, y=0)
plt.show() # 词云图


 2631
2631

 被折叠的 条评论
为什么被折叠?
被折叠的 条评论
为什么被折叠?
 到【灌水乐园】发言


