


系列文章目录
Python搭建自己的基金查看管理Web项目(一)
Python搭建自己的基金查看管理Web项目(二)
Python搭建自己的基金查看管理Web项目(添加预览历史数据功能)
Python搭建自己的基金查看管理Web项目(实现前后端分离)
前言
因为我买的基金比较多,超过10支,然后每天2:40以后开始看那些基金的涨跌的时候总有一些会漏掉(或者很麻烦),所以我就想在这个列表里面加一个提醒当在一段时间内达到最高最低点就提醒出来,这样有个直观的表现比较好,就不需要一个个的点进去看了
本篇实现的功能比较简单就单纯的写下前后端的改动
一、设计思路
- 我们可以天天基金的基金详情API获取基金的全部数据(各个时间段的基金净值)
- 然后根据今日的预估净值和历史数据进行对比,如果达到最高或者最低就进行提醒
二、后端改动
- 在数据里新建一个历史数据表
class HistoryRate(models.Model):
   fund_id = models.CharField(max_length=10)
   date = models.BigIntegerField()
   value = models.FloatField()
   type = models.CharField(max_length=100, default="")
- 编写抓取历史数据的接口
def rerfreshHistoryById(id):
   head = 'http://fund.eastmoney.com/pingzhongdata/'
   tail = '.js?v=' + time.strftime("%Y%m%d%H%M%S", time.localtime())
   detail_url = head + id + tail
   content = requests.get(detail_url)
   jsContent = execjs.compile(content.text)
   # 单位净值走势
   netWorthTrend = jsContent.eval('Data_netWorthTrend')

   # delete first
   cached_history = HistoryRate.objects.filter(fund_id = id)
   cached_history.delete()

   historyList = []
   for item in netWorthTrend:
       if item['y'] != None:
           bean = HistoryRate(fund_id = id, date = item['x'], value = item['y'])
           historyList.append(bean)

   HistoryRate.objects.bulk_create(historyList)
- 在返回的总数据的对象里面添加一个新的字段用来展示这个高低点提醒 notes
- 从数据库读取当前基金的所有的历史数据,和今日的数据进行对比,看是不是高低点
def judgeMaxOrMinVal(group, val, type):
    max_value = max(list(map(lambda x: x.value, group)))
    min_value = min(list(map(lambda x: x.value, group)))
    if val > max_value:
        return 'Hit <strong>Max</strong> value in last <strong>{}</strong> -> {}[{}]'.format(type, max_value, val)
    if val < min_value:
        return 'Hit <strong>Min</strong> value in last <strong>{}</strong> -> {}[{}]'.format(type, min_value, val)
    return None

def getNotesFromHistory(historyData, currentVal):
    cur_date = datetime.datetime.now()
    # 首先判断是不是一年最大最小值
    year_group = list(filter(lambda item: item.date >  (cur_date - relativedelta(years=1)).timestamp()*1000, historyData))
    year_notes = judgeMaxOrMinVal(year_group, currentVal, '1 year')
    if year_notes != None:
        return year_notes
    # 然后判断3个月内的数据
    m3_group = list(filter(lambda item: item.date >  (cur_date - relativedelta(months=3)).timestamp()*1000, historyData))
    m3_notes = judgeMaxOrMinVal(m3_group, currentVal, '3 months')
    if m3_notes != None:
        return m3_notes
    # 判断一个月内的数据
    m1_group = list(filter(lambda item: item.date >  (cur_date - relativedelta(months=1)).timestamp()*1000, historyData))
    m1_notes = judgeMaxOrMinVal(m1_group, currentVal, '1 months')
    if m1_notes != None:
        return m1_notes
    # 判断7天内的数据
    d7_group = list(filter(lambda item: item.date >  (cur_date - relativedelta(days=7)).timestamp()*1000, historyData))
    d7_notes = judgeMaxOrMinVal(d7_group, currentVal, '7 days')
    if d7_notes != None:
        return d7_notes
    return ''
- 返回结果
notes = ''
lastDateInHistory = ''
 if item.fund_id in allHistoryRateDataObj:
     notes = getNotesFromHistory(allHistoryRateDataObj[item.fund_id],item.gsz)
 obj = {"fund_id": item.fund_id, "dwjz": item.dwjz, "gszzl": item.gszzl, "gsz": item.gsz,
        "name": fund_obj[item.fund_id], "tag": tag, "amount": fund_amt[item.fund_id], "notes": notes}
 context['funds'].append(obj)
三、前端改动
因为数据已经在后端准备好,所以前端的改动很简单,就是新展示一个字段在table里面(这里吹一句,vue是真强啊)
 <el-table-column prop="notes" label="Note">
      <template #default="scope">
        <span :class="scope.row.notes.indexOf('Max') > -1 ? 'max-info' : 'min-info'" v-html="scope.row.notes" />
      </template>
</el-table-column>
结果展示
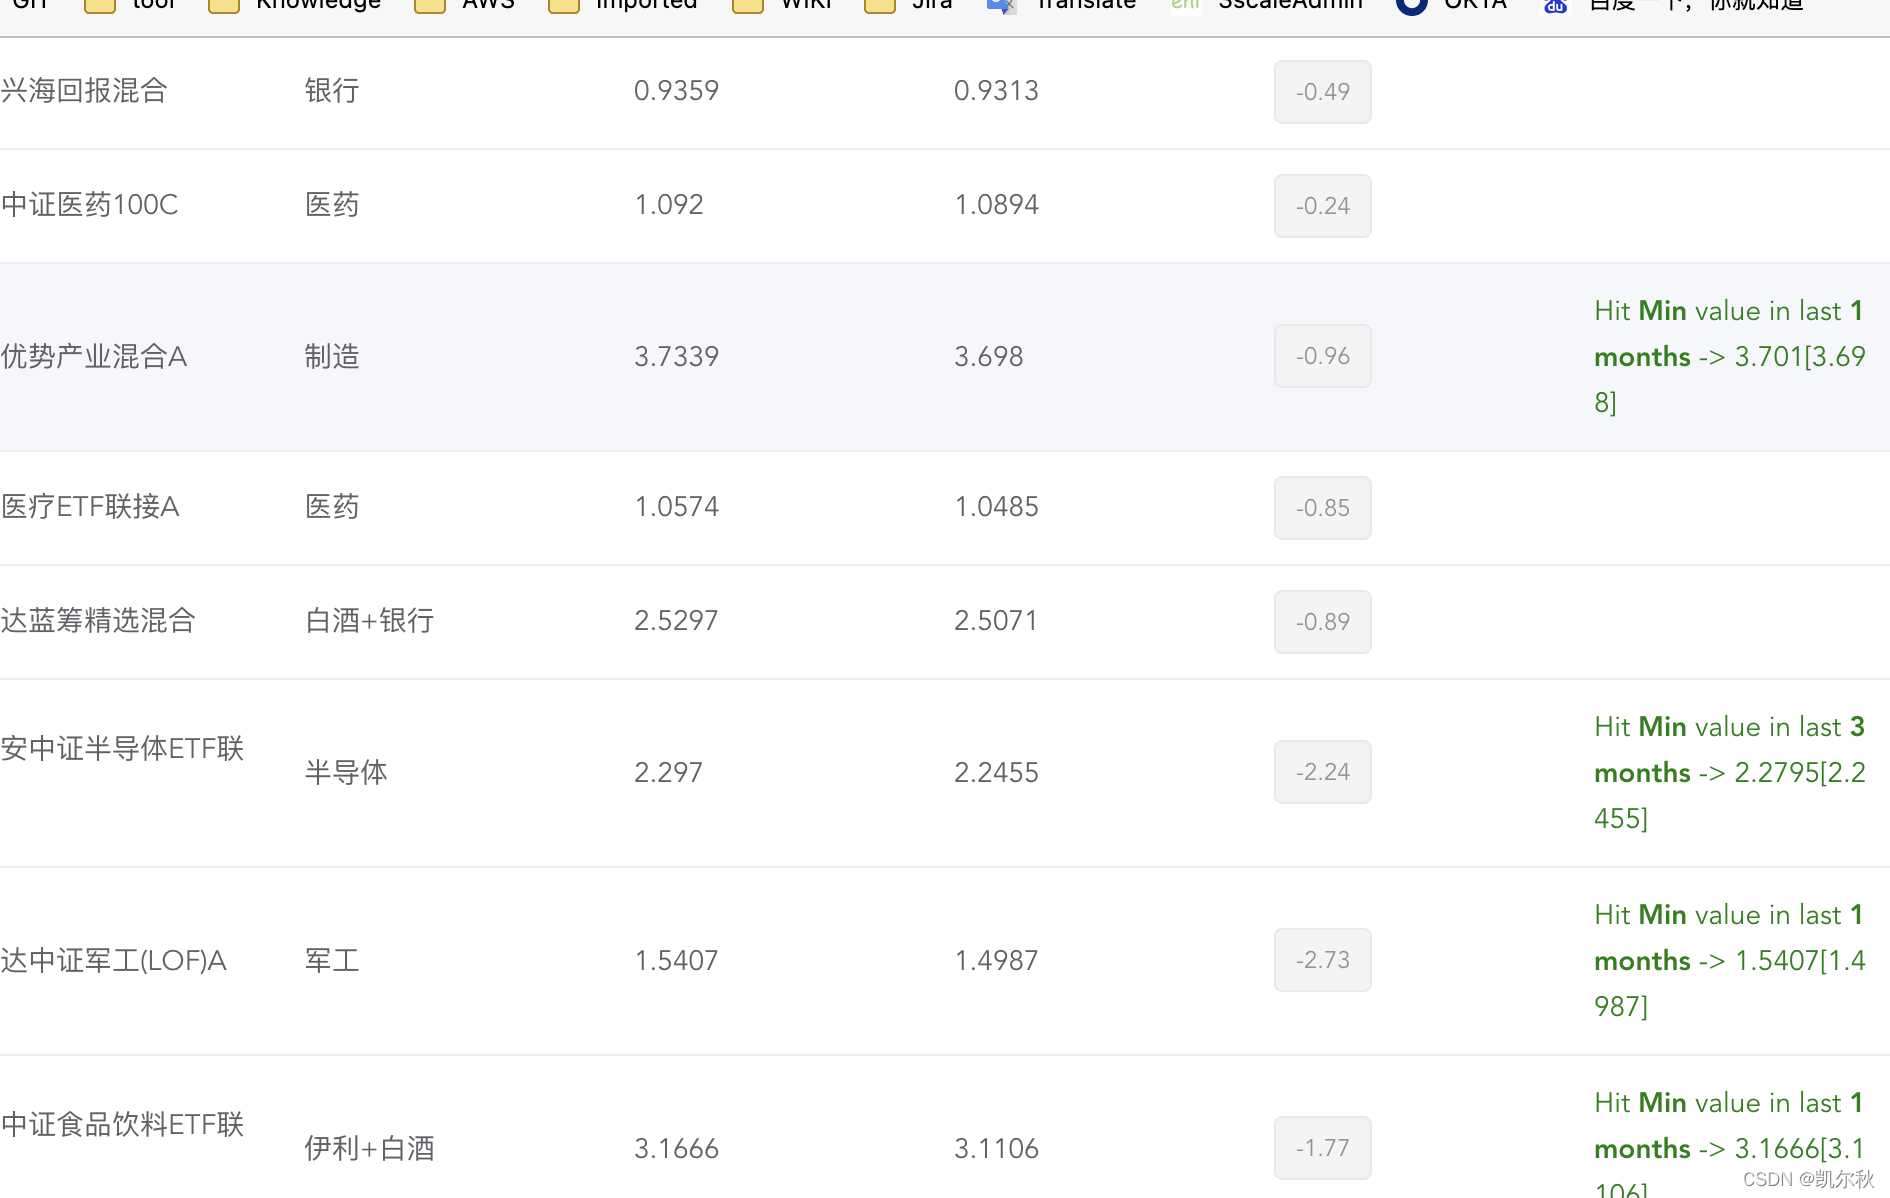
需要源码的可以评论留言或者私信我都可以,大家一起交流一起进步。


 5146
5146


 到【灌水乐园】发言


