


 本文详细介绍了如何使用jQueryGantt,包括下载资源、解决中文乱码问题、样式优化以及如何实现甘特图头部信息的悬浮显示。通过修改js和css文件,实现了甘特图的数据条颜色扩展、最小高度设置、左侧信息宽度调整等,并提供了悬浮框的html、css和js实现方法。
项目需要,在网上找了许多开源免费的甘特图资源考虑到自定义拓展和应用的难易程度最后原则了jQueryGantt甘特图,接下来就记录一下自己的使用过程。本文章主要包括以下内容:
1.jQueryGantt下载
这里感谢一下这位朋友的分享 JQuery.Gantt(甘特图) 开发指南 , 附下载资源
我就是下载了他的资源并对test1的 js和css进行了扩展 test2的效果图也不错有兴趣的朋友可以自己扩展一下。
2.jQueryGantt的引用与说明(解决中文日期utf-8编码格式乱码问题)
js、css的引用很简单,参考test1中的index.html就可以,把js、css、img都引用到自己的项目中即可。
这里重点想说的就是中文乱码问题,上面的文章告诉我们在js文件引用中加上charset特性并设置为GB2312来解决这个问题。但是我习惯用utf-8编码,所以就事先修改原js的编码格式再进行修改:
1.首先用记事本打开jquery.fn.gantt.js;
2.另存为,选择“带有BOM的UTF-8”编码方式

这个方法同理可以解决各种需要转编码格式的问题。
jquery.fn.gantt.js文件中$.fn.gantt = function (options)中修改以下部分,即可显示中文月份与日期
dow: ["日", "一", "二", "三", "四", "五", "六"],
months: ["一月", "二月", "三月", "四月", "五月", "六月", "七月", "八月", "九月", "十月", "十一月", "十二月"],
接下来是html部分:
<div class="gantt"></div>
直接一个div引用,因为自己想要一个平铺布满这个屏幕的甘特图所以对于样式进行了一点点的优化,具体可参考下一部分。
引用jQueryGantt的js方法:
配合我的效果图对数据源格式进行说明

//初始化gantt
   $(".gantt").gantt({
   //source:甘特图数据源
       source: [
           {
               name: "100002",
               desc: "32一体化传感器(电子式)",
               values: [{
                   from: "2021-03-05", //时间单位为毫秒 试了一下这种格式的也是可以的
                   to: "2021-03-24",
                   label: "20",
                   customClass: "ganttRed", //甘特图数据条的颜色,有ganttRed ganttGreen ganttOrange ganttBlue(默认),可自定义在css中扩展
                   dataObj: {id:"0001"} //onItemClick方法中的data  我也是看了源码之后才知道有dataObj这个属性
               }, {
                   from: "2021-03-26",
                   to: "2021-03-30",
                   label: "5",
                   customClass: "ganttBlue",
                   dataObj: {id:"0002"}
               }]
           },
           {
               name: "100002",
               desc: "32一体化传感器(电子式)",
               values: [{
                   from: "2021-04-10",
                   to: "2021-04-30",
                   label: "21",
                   customClass: "ganttGreen",
                   dataObj: {

                   }
               }]
           }
       ],
       navigate: 'scroll',//底部使用的是拖拽进度还是按钮:scroll和buttons
       scale: "days",// 设置默认比例,选项:months  weeks days  hours
       maxScale: "months",//最大比例,选项如上
       minScale: "days",//最小比例,选项如上
       itemsPerPage: 999,//甘特图每页的信息数量
       onItemClick: function (data) {
           console.log(data);//这里的data就是source values中的dataObj
       },
       onAddClick: function () {//无数据范围内的点击事件
           return;
       },
       onRender: function () {//渲染事件

       }
   });
3.样式的优化
(1)甘特图数据条的颜色扩展
style.css:找到以下部分在其下面扩展自己的颜色 .fn-label为甘特图数据条上的文字
.fn-gantt .ganttOrange {
    background-color: #FCD29A;
}
.fn-gantt .ganttOrange .fn-label {
    color: #714715 !important;
}
(2)设置甘特图的最小高度并让底部条一直显示在底部
当甘特图数据很少的时候甘特图的整个div高度就很小看起来效果不太好所以想设置一个最小高度,设置好后又发现底部条显示在甘特图的底部而不是整个容器的底部所以又进行了调整
style.css:
.gantt {
    width: 100%;
    /*margin: 20px auto;*/
    border: 2px solid #ddd;
    position: relative;
    -webkit-border-radius: 6px;
   -moz-border-radius: 6px;
    border-radius: 6px;
    -webkit-box-sizing: border-box;
   -moz-box-sizing: border-box;
    box-sizing: border-box;
}

.gantt:after {
    content: ".";
    visibility: hidden;
    display: block;
    height: 0;
    clear: both;
}

.fn-gantt {
    width: 100%;
    min-height: 500px;
    position: relative;
}

.fn-gantt *,
.fn-gantt *:after,
.fn-gantt *:before {
    -webkit-box-sizing: border-box;
    -moz-box-sizing: border-box;
    box-sizing: border-box;
}

.fn-gantt .fn-content {
    padding-bottom: 50px;
}
(3)左侧信息的宽度
本身的左侧的宽度太小不符合项目需求所以修改了一下
style.css:
/* === LEFT PANEL === */

.fn-gantt .leftPanel {
    float: left;
    width: 400px;
    overflow: hidden;
    border-right: 1px solid #DDD;
    position: relative;
    z-index: 20;
}

.fn-gantt .leftPanel .fn-label {
    display: inline-block;
    margin: 0 0 0 5px;
    color: #484A4D;
    width: 100%;
    white-space: nowrap;
    text-overflow: ellipsis;
    overflow: hidden;
}

.fn-gantt .leftPanel .row {
    border-bottom: 1px solid #DDD;
}
.fn-gantt .leftPanel .name, .fn-gantt .leftPanel .desc {
    float: left;
    height: 24px;
    width: 50%;
    background-color: #f6f6f6;
}

.fn-gantt .leftPanel .name {
    font-weight: bold;
}

.fn-gantt .leftPanel .fn-wide, .fn-gantt .leftPanel .fn-wide .fn-label {
    width: 100%;
}

.fn-gantt .leftPanel .spacer {
    background-color: #f6f6f6;
    width: 100%;
}
最后我自己的效果图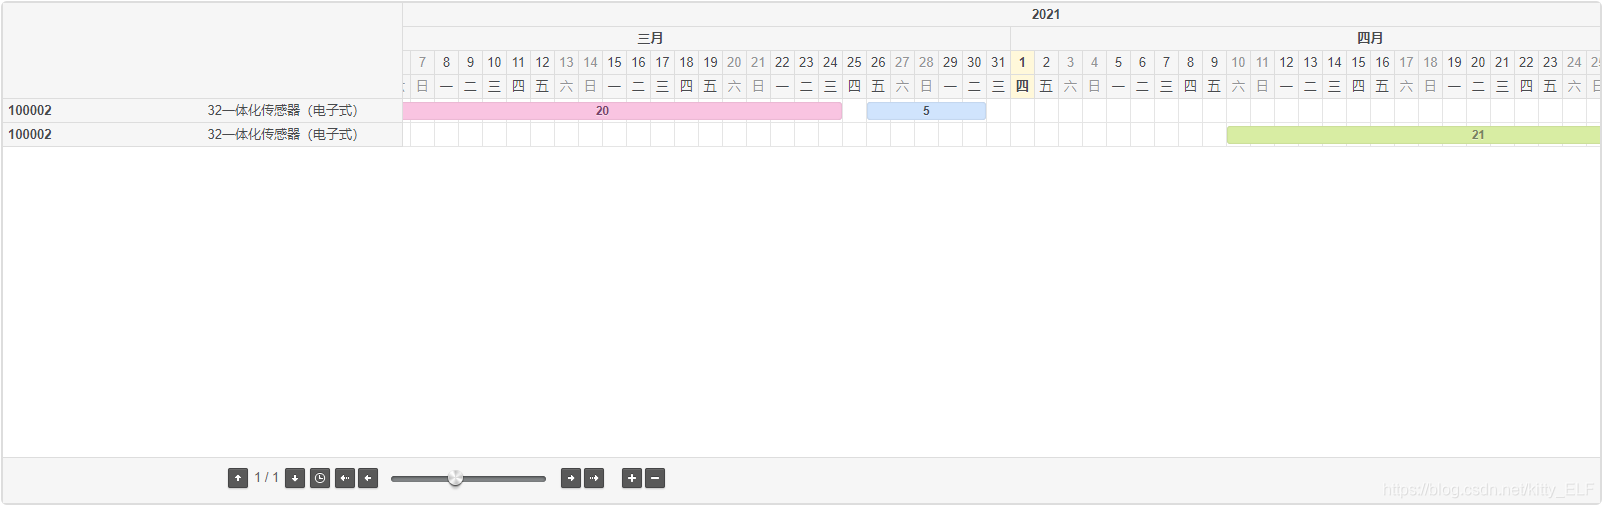
4.拓展:甘特图头部信息悬浮显示更多信息
新要求:鼠标悬浮在甘特图的头部显示这一行数据的更多信息,效果如图:
这里就是需要在绘制甘特图row name 时追加mouseover和mouseout方法,再自定义设计一个悬浮框,根据悬浮框的大小和第几行数据来定位悬浮框的显示位置。
html部分:
<div class="gantt"></div>
<div id="mouseoverDiv">
    <div class="arrow left" style="top: 50%;"></div>
    <div class="mouseoverCon">
        <table>
            <tr>
                <th class="con con-left"><span id="con-planId" style="margin-right:10px;color:#006393;"></span></th>
                <th class="con con-right"><span id="con-name"></span></th>
            </tr>
            <tr>
                <td class="con con-left"><span>排程周期:</span></td>
                <td class="con con-right"><span id="con-time"></span></td>
            </tr>
            <tr>
                <td class="con con-left"><span>总完成量:</span></td>
                <td class="con con-right"><span id="con-num"></span></td>
            </tr>
        </table>
    </div>
</div>
css部分:
#mouseoverDiv {
    position: absolute;
    top: 0;
    left: 400px;
    z-index: 1060;
    display: none;
    padding: 1px;
    font-family: "Helvetica Neue",Helvetica,Arial,sans-serif;
    font-size: 14px;
    font-style: normal;
    font-weight: 400;
    line-height: 1.42857143;
    text-align: left;
    text-align: start;
    text-decoration: none;
    text-shadow: none;
    text-transform: none;
    letter-spacing: normal;
    word-break: normal;
    word-spacing: normal;
    word-wrap: normal;
    white-space: normal;
    background-color: #fff;
    -webkit-background-clip: padding-box;
    background-clip: padding-box;
    border: 1px solid #ccc;
    border: 1px solid rgba(0,0,0,.2);
    border-radius: 6px;
    -webkit-box-shadow: 0 5px 10px rgba(0,0,0,.2);
    box-shadow: 0 5px 10px rgba(0,0,0,.2);
    line-break: auto;
    height: 110px;
    width: 400px;
}
.arrow {
    position: absolute;
    display: block;
    width: 0;
    height: 0;
    border-color: transparent;
    border-style: solid;
    border-width: 11px;
}
.arrow.left {
    top: 50%;
    left: -11px;
    margin-top: -11px;
    border-right-color: #999;
    border-right-color: rgba(0,0,0,.25);
    border-left-width: 0;
}
.mouseoverCon table{
    width: 100%;
}
.mouseoverCon td, .mouseoverCon th{
    padding: 4px 0;
}
.mouseoverCon th {
    background-color: #e5e5e5;
    padding: 15px 0;
}
.con-left{
    text-align: right;
}
.row.name .fn-label:hover, .row.name .fn-label:visited {
    color: #006393;
    text-decoration: underline;
    cursor: pointer;
}
js部分:
修改jquery.fn.gantt.js,找到leftPanel方法,在row name div中追加onmouseover和onmouseout,在row desc中也加了
entries.push(
   '<div class="row name row' + i +
    (entry.desc ? '' : (' fn-wide '+dataId)) +
    '" id="rowheader' + i +
    '" data-offset="' + i % settings.itemsPerPage * tools.getCellSize() + '" οnmοuseοver="onItemOver(' + i + ', this, \'' + entry.name + '\')" οnmοuseοut="onItemOut()" οnclick="searchPlans(\'' + entry.name + '\')">' +
    '<span class="fn-label' +
    (entry.cssClass ? ' ' + entry.cssClass : '') + '">' +
    (entry.name || '') +
    '</span>' +
    '</div>');

if (entry.desc) {
    entries.push(
        '<div class="row desc row' + i +
        ' " id="RowdId_' + i + dataId + '" οnmοuseοver="onItemOver(' + i + ', this, \'' + entry.name + '\')" οnmοuseοut="onItemOut()">' +
        '<span class="fn-label' +
        (entry.cssClass ? ' ' + entry.cssClass : '') + '">' +
        entry.desc +
        '</span>' +
        '</div>');
}
//鼠标悬浮事件
function onItemOver(i, e, planId) {
    $.post("/Scheduling/GetPlanInfo", { PlanId: planId }, function (data) {
        $("#con-planId").html(data.planId);
        $("#con-name").html(data.invName);
        $("#con-time").html(data.productionCycle);
        $("#con-num").html(data.quantity);
        $("#mouseoverDiv").css("display", "block");
        $("#mouseoverDiv").css("top", (i * 24 + 54) + "px"); //i为甘特图的行数 24为每行甘特图的高度
    })
}
//鼠标移除事件
function onItemOut() {
    $("#mouseoverDiv").css("display", "none");
}
甘特图数据图形上的悬浮事件也可以用同样的方法设计。
OK!以上就是我这次使用jQueryGantt遇到的问题及解决办法,其实有时间还是建议大家看看js源码真的让我学习到很多,最后愿我这篇文章给大家带来帮助,有什么问题欢迎留言,大家互相学习~


 7972
7972

 被折叠的 条评论
为什么被折叠?
被折叠的 条评论
为什么被折叠?
 到【灌水乐园】发言


