


 本文介绍如何在uni-app项目中集成并使用ECharts图表组件,包括配置过程、动态加载echarts库的方法以及如何更新图表数据。
公司要做app,选型选的uni-app,奈何之前没接触过。
一步一步摸索着把框架搭建好了,发现app中有图表,那我图表又用什么呢?
又去翻文档,又是百度的。
最后还是在 官方找到合适的答案
ECharts页面模板
ECharts页面模板是 mpvue-echarts 的使用示例模板,本示例引用了 mpvue-echarts 和 百度的 echarts
如不考虑小程序,那么App端和H5端,可以通过renderjs技术来使用echart、f2等web图表,功能性能比uchart更好。什么是renderjs、基于renderjs使用echart的示例
通过这个顺着找到了renderjs-echarts-demo
下载下来是目录结构
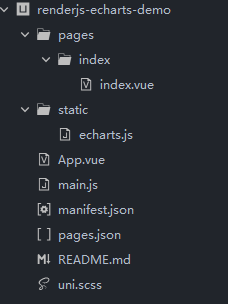
打开index.vue
<template>
	<view class="content">
		<!-- #ifdef APP-PLUS || H5 -->
		<view @click="echarts.onClick" :prop="option" :change:prop="echarts.updateEcharts" id="echarts" class="echarts"></view>
		<button @click="changeOption">更新数据</button>
		<!-- #endif -->
		<!-- #ifndef APP-PLUS || H5 -->
		<view>非 APP、H5 环境不支持</view>
		<!-- #endif -->
	</view>
</template>

<script>
	export default {
		data() {
			return {
				option: {
					title: {
						text: 'ECharts 入门示例'
					},
					tooltip: {},
					legend: {
						data: ['销量']
					},
					xAxis: {
						data: ["衬衫", "羊毛衫", "雪纺衫", "裤子", "高跟鞋", "袜子"]
					},
					yAxis: {},
					series: [{
						name: '销量',
						type: 'bar',
						data: [5, 20, 36, 10, 10, 20]
					}]
				}
			}
		},
		onLoad() {

		},
		methods: {
			changeOption() {
				const data = this.option.series[0].data
				// 随机更新示例数据
				data.forEach((item, index) => {
					data.splice(index, 1, Math.random() * 40)
				})
			},
			onViewClick(options) {
				console.log(options)
			}
		}
	}
</script>

<script module="echarts" lang="renderjs">
	let myChart
	export default {
		mounted() {
			if (typeof window.echarts === 'function') {
				this.initEcharts()
			} else {
				// 动态引入较大类库避免影响页面展示
				const script = document.createElement('script')
				// view 层的页面运行在 www 根目录,其相对路径相对于 www 计算
				script.src = 'static/echarts.js'
				script.onload = this.initEcharts.bind(this)
				document.head.appendChild(script)
			}
		},
		methods: {
			initEcharts() {
				myChart = echarts.init(document.getElementById('echarts'))
				// 观测更新的数据在 view 层可以直接访问到
				myChart.setOption(this.option)
			},
			updateEcharts(newValue, oldValue, ownerInstance, instance) {
				// 监听 service 层数据变更
				myChart.setOption(newValue)
			},
			onClick(event, ownerInstance) {
				// 调用 service 层的方法
				ownerInstance.callMethod('onViewClick', {
					test: 'test'
				})
			}
		}
	}
</script>

<style>
	.content {
		display: flex;
		flex-direction: column;
		align-items: center;
		justify-content: center;
	}

	.echarts {
		margin-top: 100px;
		width: 100%;
		height: 300px;
	}
</style>
根据这个最后自己修改了一下,echarts.vue
<template>
  <view
    :prop="option"
    :change:prop="echarts.updateEcharts"
    :id="option.id"
    class="echarts"
    @click="echarts.onClick"></view>
</template>

<script>
	export default {
    props: {
      option: {
        type: Object,
        required: true
      },
    },
		data() {
			return {}
		},
		created() {
			this.option.id = this.getId()
      console.log('iiii',this.option.id)
		},
		methods: {
      // 随机生成一个id 避免id重复
      getId (len = 36) {
        return Number(Math.random().toString().substr(3,len) + Date.now()).toString(len)
      },
			onViewClick(options) {
				this.$emit('click', options)
			}
		}
	}
</script>

<script module="echarts" lang="renderjs">
	let myChart
	export default {
		mounted() {
			if (typeof window.echarts === 'function') {
				this.initEcharts()
			} else {
				// 动态引入较大类库避免影响页面展示
				const script = document.createElement('script')
				// view 层的页面运行在 www 根目录,其相对路径相对于 www 计算
				script.src = 'static/echarts.js'
				script.onload = this.initEcharts.bind(this)
				document.head.appendChild(script)
			}
		},
		methods: {
			initEcharts() {
				myChart = echarts.init(document.getElementById(this.option.id))
				// // 观测更新的数据在 view 层可以直接访问到
				myChart.setOption(this.option)
			},
			updateEcharts(newValue, oldValue, ownerInstance, instance) {
        console.log(newValue)
				// 监听 service 层数据变更
				myChart.setOption(newValue)
			},
			onClick(event, ownerInstance) {
        console.log('event', event, ownerInstance)
				// 调用 service 层的方法
				ownerInstance.callMethod('onViewClick', event)
			}
		}
	}
</script>

<style lang="less" scoped>
  .echarts{
    width: 100%;
    height: 300upx;
  }
</style>
在页面中引入使用此组件
<template>
  <view class="">
	<echarts :option="option"/>
	<div @click="upDate">更新数据</div>
  </view>
</template>
<script>
  import echarts from '../../components/echarts/index.vue'
export default {
  components: {
    echarts
  },
   data() {
      return {
				option: {
					title: {
						text: 'ECharts 入门示例'
					},
					tooltip: {},
					legend: {
						data: ['销量']
					},
					xAxis: {
						data: ["衬衫", "羊毛衫", "雪纺衫", "裤子", "高跟鞋", "袜子"]
					},
					yAxis: {},
					series: [{
						name: '销量',
						type: 'bar',
						data: [5, 20, 36, 10, 10, 20]
					}]
				}

      }
   },
   mounted() {
   },
   created() {
   },
   methods:{
   },
}
</script>
<style lang='less' scoped>
</style>


 4737
4737

 被折叠的 条评论
为什么被折叠?
被折叠的 条评论
为什么被折叠?
 到【灌水乐园】发言


